Aerial Photographs
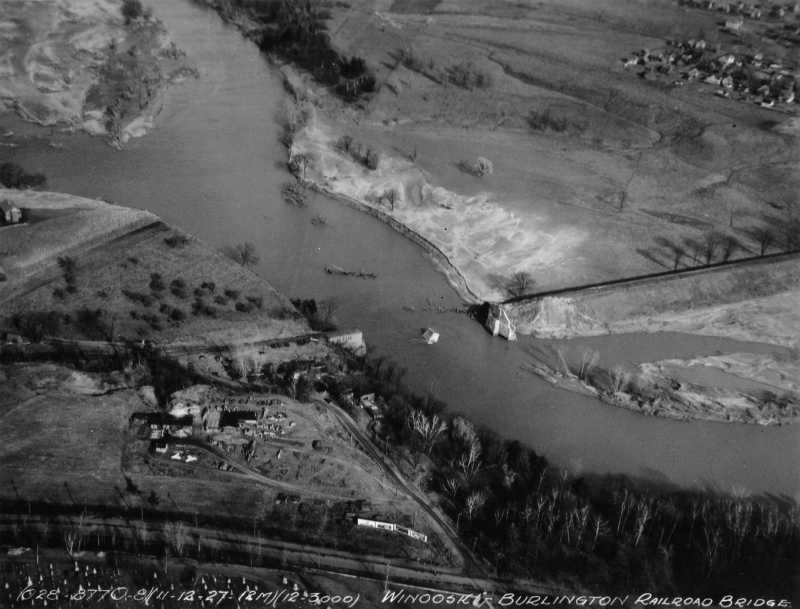
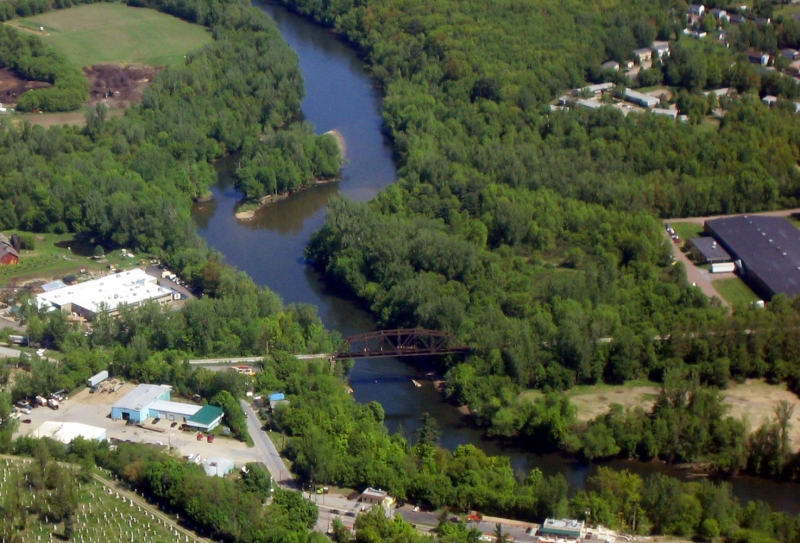
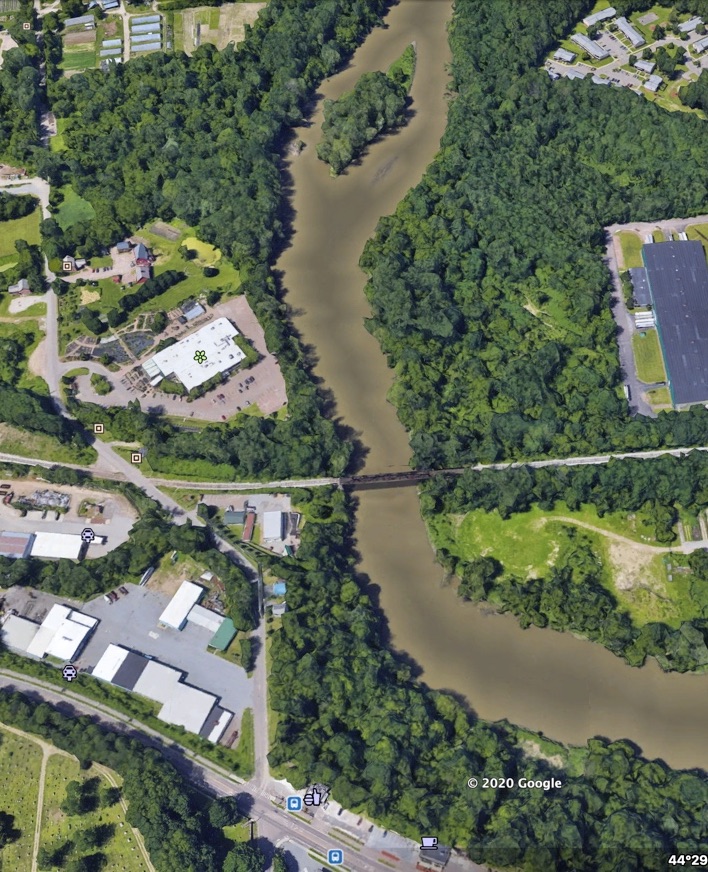
There has been significant channel change over time with the 1927 flood having ripped the bridge off its abutments with the right abutment having been severely undercut and the nearby bank badly eroded with sand deposited upon the floodplain to the east of the river. Since the 1927 flood, the bridge has been rebuilt and most of the floodplain was reforested and a side channel in the left middle of the 1927 image has been filled. An island also was created in the middle of the channel with the channel width having decreased.
Flood Probability
| Peak Streamflow | Average Streamflow | |
| Mean (cfs) | 22082.39 | 1817.35 |
| Standard Deviation (cfs) | 11505.9 | 441.87 |
| Percent Standard Deviation (%) | 0.0052 | 0.0024 |
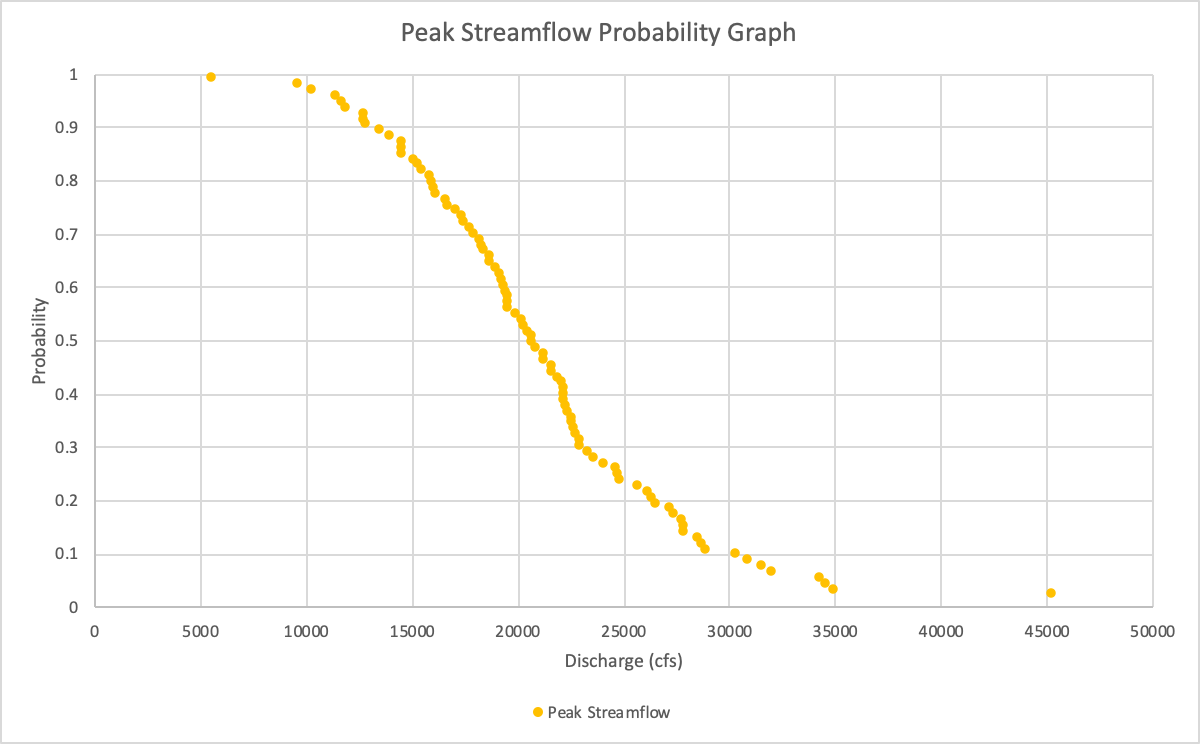
Within the datasets the peak flow data has a higher mean and standard deviation compared to the average values showing that data makes sense and isn’t corrupted or anything. The peak flow values have a slightly higher variability compared to the average flow values based upon the standard deviation percentages. Note that the peak streamflow dataset accounts for the 1927 flood and the average streamflow dataset doesn’t. The presence or lack of the1927 flood value could increase the differences in the means, standard deviations, and percent standard deviations between the datasets.