
| Runoff Calcs | Rainfalls | 1999 | 2018 |
| Paved Surfaces 98% | 2yr, 1hr 1.0in | Area Percentages | Area Percentages |
| Unpaved Surfaces 90% | 2yr, 24hr 2.3in | Paved 60% | Paved 70% |
| Woods (good) 30% | 100yr, 1hr 2.2in | Unpaved 15% | Unpaved 10% |
| Lawns (good) 39% | 100yr, 24hr 4.83in | Lawns 25% | Lawns 20% |
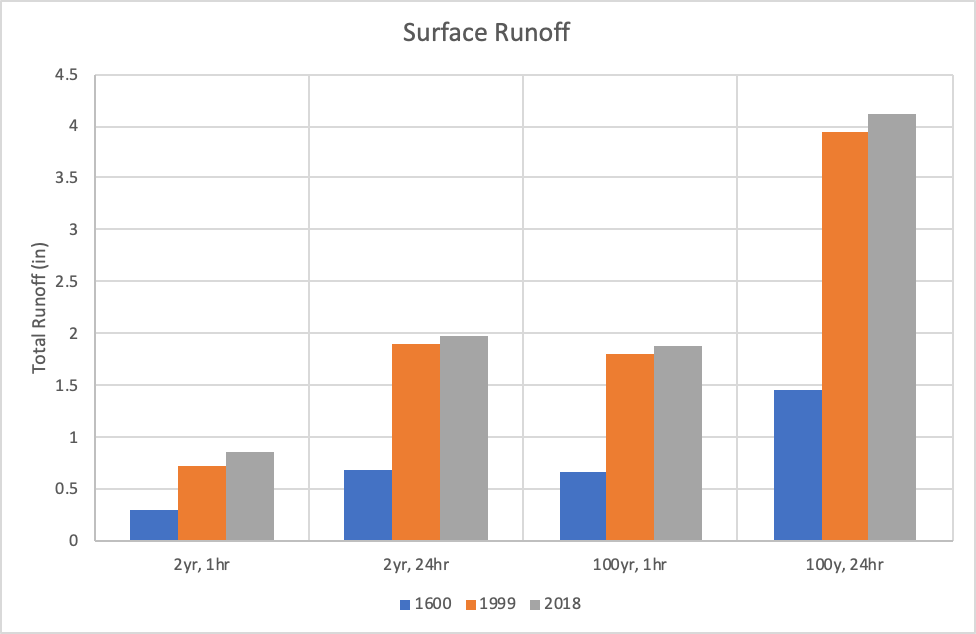
| Scenario | 1600 | 1999 | 2018 |
| 2yr, 1hr | 0.3 | 0.73 | 0.86 |
| 2yr, 24hr | 0.69 | 1.89 | 1.97 |
| 100yr, 1hr | 0.66 | 1.8 | 1.87 |
| 100y, 24hr | 1.45 | 3.95 | 4.12 |
Raw calculations example: 2yr, 1hr runoff with rainfall of 1.0in for 1999. 25% lawn at 39% runoff, 15% unpaved at 90% runoff, and 60% paved at 98% runoff. Total runoff =rainfall * percent area * percent runoff = (1)(0.25)(0.39)+(1)(0.15)(0.9)+(1)(0.6)(0.98)= 0.1 + 0.14 + 0.59 = 0.73in.
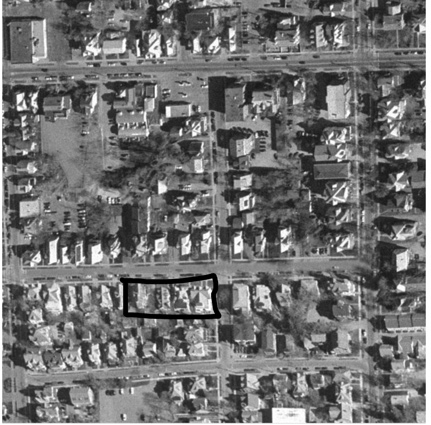
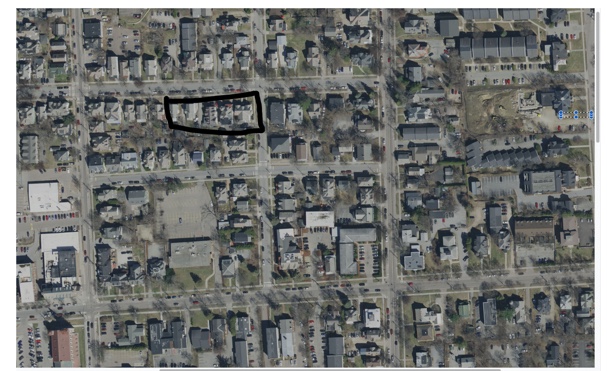
Landuse change has significantly impacted groundwater infiltration resulting in increasing runoff since the pre-European settlement fully forested landscape and over the 19 year period from 1999 to 2018. On this set of properties, landcover types moderately changed from 1999 to 2018 with the amount of paved areas increasing by 10% and the unpaved areas and lawn both decreasing by 5%. The 1998 landcover types were drastically different from the 1600 pre-settlement landcover with the forest replaced by a combination of lawns, paved, and unpaved areas which account for the entirety of the area previously occupied by forest.
These shifts were shown in the amount of rainfall doubling or tripling from 1600 to 1999 and mildly increasing from 1999 to 2018. This trend is depicted by the below graph which compares the predicted total runoff for all rainfall scenarios in 1600, 1999, and 2018.
This change in landcover resulting from the different landuses across time in neighborhoods near UVM will affect Lake Champlain water quality negatively. As witnessed by recent short-term, high rainfall precipitation events, surface runoff tends to overwhelm the city stormwater infrastructure which results in lower quality water getting forced into the Lake. The increasing amount of impervious surfaces in this neighborhood would resulted in increased surface runoff and negatively impact Lake water quality via this overfilling of the stormwater infrastructure.