Climate Change in Vermont
Download chapter PDF and figures
Authors
Caitlin Crossett
Department of Civil and Environmental Engineering, Vermont EPSCoR, Gund Institute for Environment, University of Vermont, Burlington, Vermont 05405
Mahalia Clark
Rubenstein School of Environment and Natural Resources,
Gund Institute for Environment, Quantitative and Evolutionary STEM Training Program, University of Vermont,
Burlington, Vermont 05405
Citation
Crossett, C., Clark, M., 2021. Climate Change in Vermont. In Galford, G.L., Faulkner, J. et al. (Eds), The Vermont Climate Assessment 2021. Burlington, Vermont: Gund Institute for Environment at the University of Vermont. DOI: 10.18125/kowgvg.
Table of Contents
- 1.1 Key Messages
- 1.2 Background and Global Context
- 1.3 Vermont’s Changing Climate (Methods)
- 1.4 Vermont’s Rising Temperatures
- 1.5 Increasing Precipitation
- 1.6 Climate Indicators
- 1.7 Extreme Events
- 1.8 Traceable Accounts
- 1.9 Appendix to Chapter 1
- 1.10 Acknowledgements
- 1.11 References
1.1 Key Messages
- Vermont’s annual average temperature has increased by almost 2°F (1.11°C) since 1900. Winter temperatures have increased 2.5 times faster than annual temperatures over the past sixty years, and the number of very cold nights has decreased by over seven days in the same time period.
- Average annual precipitation in Vermont has increased by 21% since 1900 and has become more variable in the last decade. Annual snowfall has been decreasing since the 1960s, yet winter precipitation has increased, suggesting that more winter precipitation is falling as rain.
- Vermont’s freeze-free period has lengthened by three weeks since 1960; the trend has accelerated to an increase of nine days per decade since 1991.
- On average, lakes and ponds across Vermont are icing-out one to three days earlier per decade since the 1970s and 1980s.
- Extreme weather events such as droughts and floods are expected to continue to increase with climate change. Vermont experiences 2.4 more days of heavy precipitation than in the 1960s, most often in summer.
1.2 Background and Global Context
The world’s climate is changing and is projected to continue to change over the next century. This chapter examines recent trends in our local climate and can help us understand how climate change will continue to affect Vermont.
1.2.1 Weather and Climate
How does climate differ from weather? Climate is the average weather (defined over 30-year averaging periods by the National Oceanic and Atmospheric Administration—NOAA) experienced in a place (e.g., you expect cold and snow in Vermont’s winters), while weather is the day-to-day variation in things like temperature and precipitation (e.g., the 10-day forecast). There is a saying that “climate is what you expect, weather is what you get”. Unfortunately, as the climate changes, it is getting increasingly difficult to know what to expect.
1.2.2 Causes of Climate Change
Climate change is largely caused by increasing heat trapped in the Earth’s atmosphere. The release of heat-trapping greenhouse gases, particularly carbon dioxide (CO2), has increased the heat in the atmosphere. Greenhouse gases act like a transparent blanket around the Earth—allowing sunlight to reach and warm the air, ground, and oceans but preventing heat from leaving the atmosphere into space. Over time, the trapped heat accumulates, warming our planet and causing temperatures to rise. Although greenhouse gases are a natural part of the atmosphere, human activities such as burning fossil fuels have drastically increased their abundance (Hayhoe et al. 2018). Like adding an extra blanket, the effect is to warm the Earth beyond the temperature variability expected based solely on natural forcings (e.g., variability of the Earth’s orbit, volcanic eruptions). Oceans absorb roughly 90% of the excess heat, but humans are starting to feel the remaining 10%, as the atmosphere warms the land.
Human activities have been releasing greenhouse gases since the beginning of the Industrial Revolution in the mid-1700s. Human sources of greenhouse gases increased dramatically in the mid-20th century as burning of fossil fuels increased. Human contributions to greenhouse gas emissions, and thus global temperature change, exceed any variations in natural factors such as the Earth’s orbit, volcanic activity, or energy emitted by the Sun (Hayhoe et al. 2018). Further, the rate of human-induced greenhouse gas emissions has increased far faster than forests, oceans, and other natural processes can remove them from the atmosphere.
1.2.3 Future Climate Change
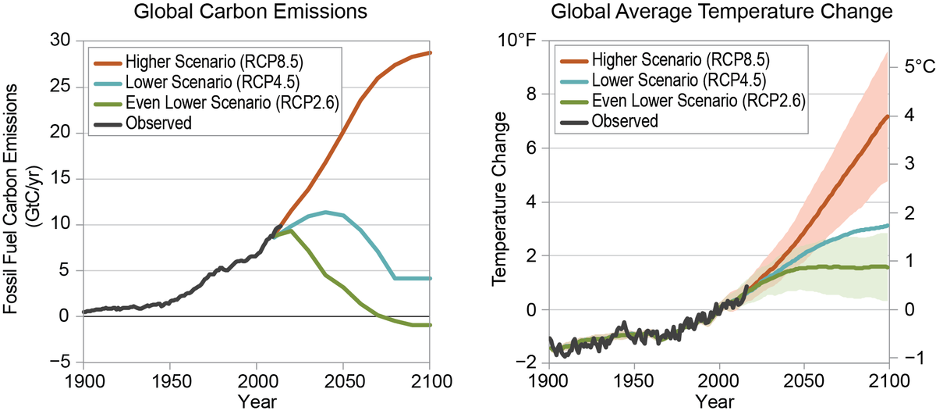
Scientists have developed scenarios that represent plausible alternative futures based on key drivers and relationships between greenhouse gas emissions and climate change mitigation actions. Scenarios are neither forecasts nor projections, but they are useful in considering which pathway(s) humans may pursue. The Intergovernmental Panel on Climate Change (IPCC), a body of the United Nations, provides global scientific analysis on climate change and defines future climate change scenarios based on four representative concentration pathways (RCPs). Each RCP corresponds to an increase in radiative forcing, or change in energy flux in the atmosphere caused by climate change by the year 2100 based on a particular scenario. RCP2.6, the most stringent mitigation scenario, has peak radiative forcing at 3 W m-2 before 2100 and then declines. The intermediate scenarios, RCP4.5 and RCP6.0, stabilize radiative forcing at 4.5 W m-2 and 6.0 W m-2 after 2100, respectively. The RCP with the highest amount of climate change, RCP8.5, has the highest radiative forcing of 8.5 W m-2 by 2100, which continues to rise after that time. RCP8.5 estimates a global increase in temperature of 3.7 degrees C, 0.63 meters sea level rise, more extreme weather events, and requires high levels of societal adaptation at a high cost by 2100 (Table 1-1; Figure 1-1; IPCC 2014).
| Global mean surface temperature change (ºC) Mean [likely range] | Global mean sea level rise (m) Mean [likely range] | |||
|---|---|---|---|---|
| Scenario | 2046–2065 | 2081–2100 | 2046–2065 | 2081–2100 |
| RCP2.6 | 1.0 [0.4 to 1.6] | 1.0 [0.3 to 1.7] | 0.24 [0.17 to 0.32] | 0.40 [0.26 to 0.55] |
| RCP4.5 | 1.4 [0.9 to 2.0] | 1.8 [1.1 to 2.6] | 0.26 [0.19 to 0.33] | 0.47 [0.32 to 0.63] |
| RCP6.0 | 1.3 [0.8 to 1.8] | 2.2 [1.4 to 3.1] | 0.25 [0.18 to 0.32] | 0.48 [0.33 to 0.63] |
| RCP8.5 | 2.0 [1.4 to 2.6] | 3.7 [2.6 to 4.8] | 0.30 [0.22 to 0.38] | 0.63 [0.45 to 0.82] |
Scientists estimate the impacts of altered atmospheric composition on the climate using global climate models (GCMs). Complex computer models, GCMs simulate how the atmosphere interacts with the oceans and landscape to understand how temperatures, precipitation, and weather patterns may change over time. Each GCM performs slightly differently, e.g., a GCM developed in Europe may more closely match the observed climate in that region compared to other regions. Typically, a large number of GCMs are run with the same scenarios, and together they predict the future climate associated with each scenario, e.g., the shaded cone in Figure 1-1 shows a range of GCM estimates.
In Vermont and across the world, the climate is changing and will continue to change over the next century. The Earth has warmed by 1.8°F since 1901 and could warm by another 3.6°F to 9°F by 2100, depending on human activities (Hayhoe et al. 2018).
1.2.4 Signs of Climate Change
Different parts of the world experience climate change differently. Warm air has the capacity to hold more moisture than cooler air. As the atmosphere’s temperature rises, evaporation and humidity increase. Eventually, this water vapor is released as precipitation, effectively increasing rainfall potential in some areas, even as this heat and evaporation cause other regions to suffer more droughts. The high energy in warmer and wetter air can lead to more intense storms, even hurricanes, and increases the potential for more destructive winds and heavier downpours (Dupigny-Giroux et al. 2018; Hayhoe et al. 2018). Climate-related changes in the atmosphere’s energy are increasing the variability in weather due to the stalling of weather patterns and a changing climate baseline. Increased variability means places like Vermont might experience both more frequent dry-spells or drought and more intense rainstorms (Betts 2017).
1.2.5 Vermont’s Future Climate
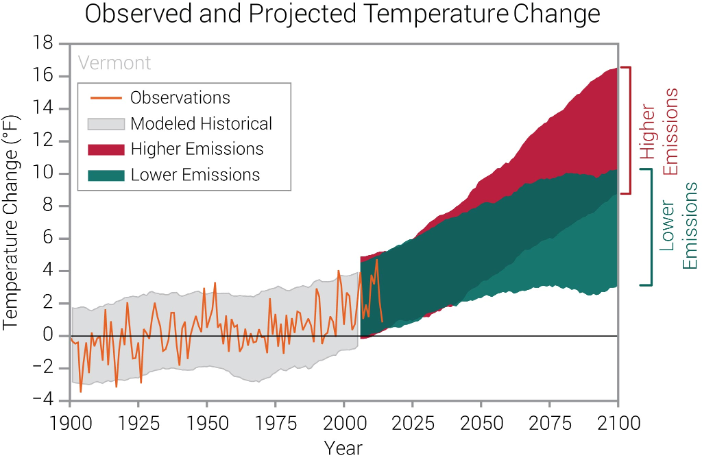
Vermont’s climate is projected to warm faster than the global average. Vermont’s temperature may warm by 5°F to 9°F, or more, by 2100 depending on the emissions scenario (Betts 2017; Figure 1.2). Rising temperatures will increase the freeze-free growing season in the Northeast by two-to-three weeks by the middle of this century (Dupigny-Giroux et al. 2018). As ice and snow melt earlier in the spring, longer and warmer summers could lead to more evaporation, which could favor more frequent summer droughts (Betts 2017). At the same time, the total amount and intensity of precipitation is expected to increase, particularly in winter and spring (Betts 2017). Across the Northeast, monthly precipitation for December through April is projected to increase by up to one inch by 2100 in RCP8.5, the IPCC’s highest emissions scenario (Dupigny-Giroux et al. 2018). The Northeast is also expected to experience more frequent and powerful storms (Dupigny-Giroux et al. 2018). Factors like wetter winters and springs, a faster spring thaw, and more intense rainfall could contribute to increased flooding across Vermont. Intense rainfall can be particularly hazardous when it falls on soils that are already waterlogged, as was the case with Hurricane Irene in 2011
1.3 Vermont’s Changing Climate (Methods)
In Vermont, recent decades have seen warmer temperatures, increased precipitation, earlier spring thaws, and a longer growing season. Climate models give useful projections of the climate for large regions like the entire Northeast, but they can’t always capture variations in climate at finer resolutions, such as within Vermont. Historical climate records document local trends and changes in climate within Vermont. Recent trends are likely to continue for the next few decades, so long-term climate observations from 18 weather stations around Vermont are used in this analysis.
This analysis of Vermont’s changing climate covers temperature trends; precipitation trends, including heavy precipitation and snowfall; climate indicators, including the length of the freeze-free period and the timing of ice-out; and extreme events such as flooding and droughts.
1.3.1 Historical Climate Data
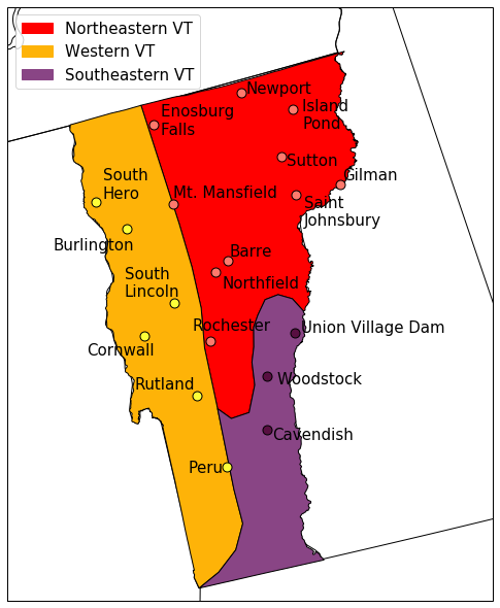
Our analyses utilized observations from 18 National Oceanic and Atmospheric Administration National Weather Service (NOAA NWS) U.S. Cooperative Observer Network weather stations across Vermont (Figure 1-3; see Table 1A-1 for station attributes). Data was acquired from the Global Summaries of the Month, Version 1 Dataset (Lawrimore et al. 2016) and from the Applied Climate Information System (DeGaetano et al. 2015; xmACIS 2021). These eighteen stations were selected because they have at least thirty years of observations with which we could compute yearly and seasonal climate variables. All climate variables were calculated for the state of Vermont and for each of its three climate divisions (northeastern, western, and southeastern). Climate divisions were defined by the U.S. Weather Bureau (now National Weather Service) and represent regions of a state that have a similar climate, similar dominant crop types, or are within the same drainage basin, and they are useful for local climate applications (Figure 1-3; Guttman and Quayle 1995).
Climate variables were calculated for each year and season, but not all stations have complete records for each year or season. Station data were used for annual analyses when there were more than ten months of good observations. (A month of good observations is defined as missing no more than five days of observations.) Otherwise, annual analyses were not calculated for that station. Station data were used for seasonal analyses if all three months in the season had good observations (again, defined as missing no more than five days per month). Seasons were defined meteorologically as follows: winter: December, January, and February (DJF), spring: March, April, and May (MAM), summer: June, July, and August (JJA), and fall: September, October, and November (SON). Annual and seasonal average values for the state were calculated as the average of annual or seasonal climate variables for all active stations with good observations; likewise, climate division average values utilized good observations within the climate division in question. Decadal mean values for the state and climate divisions were computed by averaging that decade’s annual values for all stations across the state or climate division.
As new stations came online over time, and some years or seasons were discarded for lack of good observations, the number of stations considered each year varied (Figure 1A-1). Sensitivity tests were completed to address possible impacts that the variable number of stations may pose to the following results. Representative stations were chosen as the station with the longest complete record in a climate division and were not subject to station relocation. The representative stations’ trend and decadal variability analyses were compared to analyses for the climate division. Results from sensitivity testing illustrated consistency in the magnitude and direction of trends and decadal variability between individual stations and their climate division over all time periods considered. The changing number of stations over time does not appear to impact findings. The annual standard deviation around the long-term (1900–2020) mean temperature does increase as the Mount Mansfield station comes online in 1955, but the inclusion of this station does not appear to have an impact on the magnitude of trends or decadal variability.
1.3.2 Notes on Snowfall Data
Measurements of snowfall are inherently difficult to capture due to blowing snow, measurements consistency, and varying water content in snow. Information presented here on snowfall trends and variability in snowfall started in 1930 because Vermont’s first snowfall measurements in more than one climate division began in 1930, although snowfall measurements did not start in southeastern Vermont until 1946. Snowfall is reported in inches of snow. Seasonal precipitation, including snow and rain, is reported as “liquid equivalent”, i.e., the amount of liquid produced if you were to melt frozen precipitation. Liquid equivalent precipitation measurements ensure that frozen precipitation (i.e., snow) with different water content can be directly compared. The average snow-to-liquid ratio in Vermont is 12:1 to 13:1 (Baxter et al. 2005), meaning that melting the twelve to thirteen inches of snow on the ground would produce one inch of liquid water. The snow-to-liquid ratio is highly variable across Vermont and can range more than seven inches above or below the average, the largest being 40:1 or greater (P. Banacos, personal communication, 2021). The lowest snow-to-liquid ratios (wettest snows) across the state are in southeastern Vermont due to the proximity to the Atlantic Ocean, and the highest snow-to-liquid ratios (driest snows) are in the northern portions of the western and northeastern climate divisions of Vermont (Baxter et al. 2005).
1.3.3 Statistical Analyses
Trends in climate variables were computed using the Mann-Kendall test (Kendall 1975; Mann 1945) and were evaluated for statistical significance using the pyMannKendall package in python (Hussain and Mahmud 2019). A statistically significant trend is unlikely to have occurred randomly, and so is likely a meaningful trend. Trends which are not statistically significant are unlikely to be meaningful.
1.3.4 Climate Normals
NOAA NWS considers climate the most recent thirty years of observed weather patterns and calls this climate normals. Climate normals are used daily for weather interpretation, as they help forecasters explain how current weather conditions compare to the recent past described by the climate normal. NOAA climate normals are updated every ten years in accordance with standards set by the World Meteorological Organization and an 1890 congressional mandate (National Centers for Environmental Information 2021). NOAA NWS updated climate normals in spring 2021. For Vermont, these updated values highlighted the impacts of climate change. For example, from the 1981-2010 climate normal to the 1991-2020 climate normal, the average time from Burlington’s first to last frost decreased by 6 days (shorter winter) and the average annual temperature increased from 46°F to 47.6°F (xmACIS 2021; analysis by Peter Banacos, NOAA NWS Burlington).
In this study, change in climate and long-term trends were considered for three periods: 1) near-term (1991 to 2020), consistent with the calculation of NOAA Climate Normals, 2) mid-term (1960 to 2020), and 3) long-term (1900 to 2020). The number of active stations with good observations for each time-period are shown in Figure 1A-1.
1.4 Vermont’s Rising Temperatures
Historical observations indicate Vermont’s temperatures are increasing based on near-, mid-, and long-term trends and individual seasons. A comparison of the long-term (1900-2020), mid-term (1960-2020), and near-term (1991-2020) climate periods shows accelerating rates of warming for all temperature variables—average, seasonal (except winter), minimum, and maximum temperatures (Table 1-2).
1.4.1 Average Temperatures
Vermont’s average annual temperature has increased by 2ºF (42.1ºF to 44.1ºF) in the long-term, most of which occurred more recently: 2ºF (42.6ºF to 44.1ºF) in the mid-term and 1.1ºF (43.0ºF to 44.1ºF) in the near-term (Table 1A-2).
1.4.2 Seasonal Temperature Changes
In the long-term, average temperature has increased since the early 1900s the most in winter (+3.3ºF), least in spring (+0.2ºF), and in between in summer and fall (+1.6ºF and +1.5ºF respectively; Table 1-2). Compared to the long-term mean winter temperature (1900–2020) of 19.1ºF, winter temperatures vary by +/- 0.9ºF, compared to a +/-0.6ºF variation in summer temperatures (Figure 1-5).
In the mid-term (1960–2020), average winter temperatures have warmed 2.3 and 2.8 times faster than summer and fall, respectively. Warming during this period was greatest with observed minimum temperatures: average minimum temperatures increased +3ºF, 2.6 times faster than average maximum temperatures (+1ºF) (Table 1A-3). Southeastern Vermont had the largest increase in winter minimum temperatures, warming 0.6ºF/decade since 1960 compared to 0.5ºF/decade for northeastern Vermont (Northeast Kingdom), and 0.2ºF/decade for western Vermont (Champlain Valley; not shown). From1991 to 2020, winter temperatures have increased from 19.8ºF to 20.7ºF (Table 1A-2).
| Trend (per decade) | Total change | |||||
|---|---|---|---|---|---|---|
| 1900–2020 | 1960–2020 | 1991–2020 | Since 1900 | Since 1960 | Since 1991 | |
| Annual Avg. Temperature (°F) | +0.04 | +0.26* | +0.52 | +1.95 | +1.47 | +1.04 |
| Winter (DJF) | +0.12 | +0.66* | +0.54 | +3.35 | +3.08 | +0.90 |
| Spring (MAM) | –0.03 | +0.10 | +0.15 | +0.15 | +0.94 | +0.31 |
| Summer (JJA) | +0.03 | +0.29* | +0.42 | +1.45 | +1.84 | +0.92 |
| Fall (SON) | –0.001 | +0.23* | +0.75* | +1.59 | +1.04 | +1.80 |
| Avg. Max. T. (ºF) | –0.06 | +0.18* | +0.51 | +1.06 | +1.04 | +0.84 |
| Avg. Min. T. (°F) | +0.15* | +0.47* | +0.70* | +2.79 | +2.63 | +1.33 |
| Days with max. T. > 90ºF | –0.01 | +0.11 | +0.48 | +1.49 | +1.19 | +1.32 |
| Days with min. T. > 70ºF | +0.04* | +0.20* | +0.48* | +1.14 | +1.51 | +1.15 |
| Days with max. T. < 0ºF | –0.63* | –2.08* | –3.04 | –10.81 | –10.01 | –3.97 |
| Winter days w/ max. T. > 50ºF | +0.12* | +0.31* | –0.04 | +1.85 | +1.82 | –0.17 |
- < -5
- -5 – -2
- -2 – -0.5
- -0.5 – 0
- 0 – 0.5
- 0.5 – 2
- 2 – 5
- > 5
Note: Trend values (°F/decade or days/decade) that are bolded and noted by an asterisk are statistically significant to 95% confidence. Total change since 1900 is the difference between the 1900–1909 and 2011–2020 averages, total change since 1960 is the difference between the 1960–1969 and 2011–2020 averages, and total change since 1991 is the difference between the 1991–2000 and 2011–2020 averages. There is no estimate of significance for the total change values. Cells in the table are color-coded based on their value using the key below.
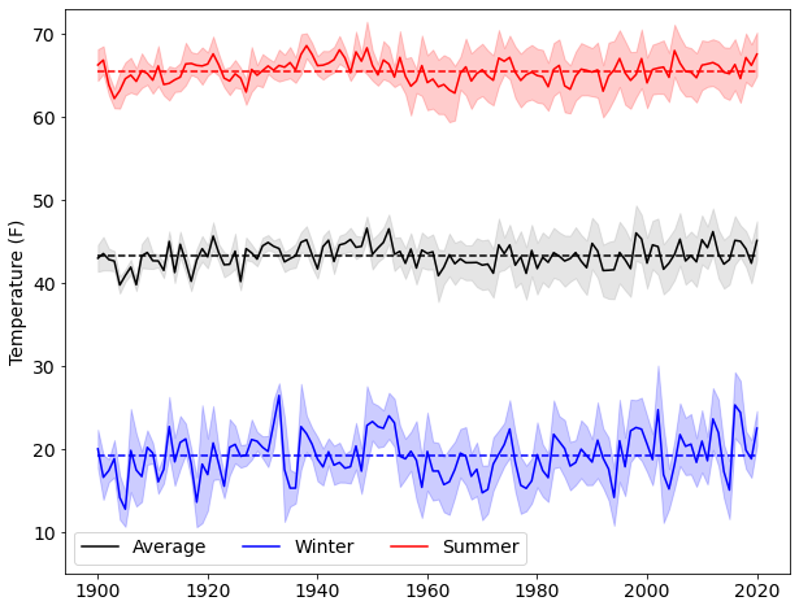
Note: Dashed lines indicate the long-term (1900–2020) mean. Shading represents the standard deviation of all observations. Increased standard deviations after 1955 can be attributed to the Mount Mansfield station coming online.
Winter warming across Vermont is reflected in the coldest nights and warmest winter days. The number of very cold nights (minimum temperature below 0ºF) has decreased, and the largest changes have been in recent decades: there have been 0.6 fewer very cold nights per decade since 1900, two fewer very cold nights/decade since 1960, and three fewer very cold nights/decade since 1991 (Table 1-2; Figure 1-7). Southeastern Vermont has experienced the largest decreasing trend in the number of very cold nights: 2.8 days/decade since 1960 (not shown). On the other hand, warm winter days (maximum temperatures above 50ºF) have increased by almost two days since the early 1900s and by the same amount since 1960 across the state of Vermont (Table 1-1; Figures 1-6 and 1-7).
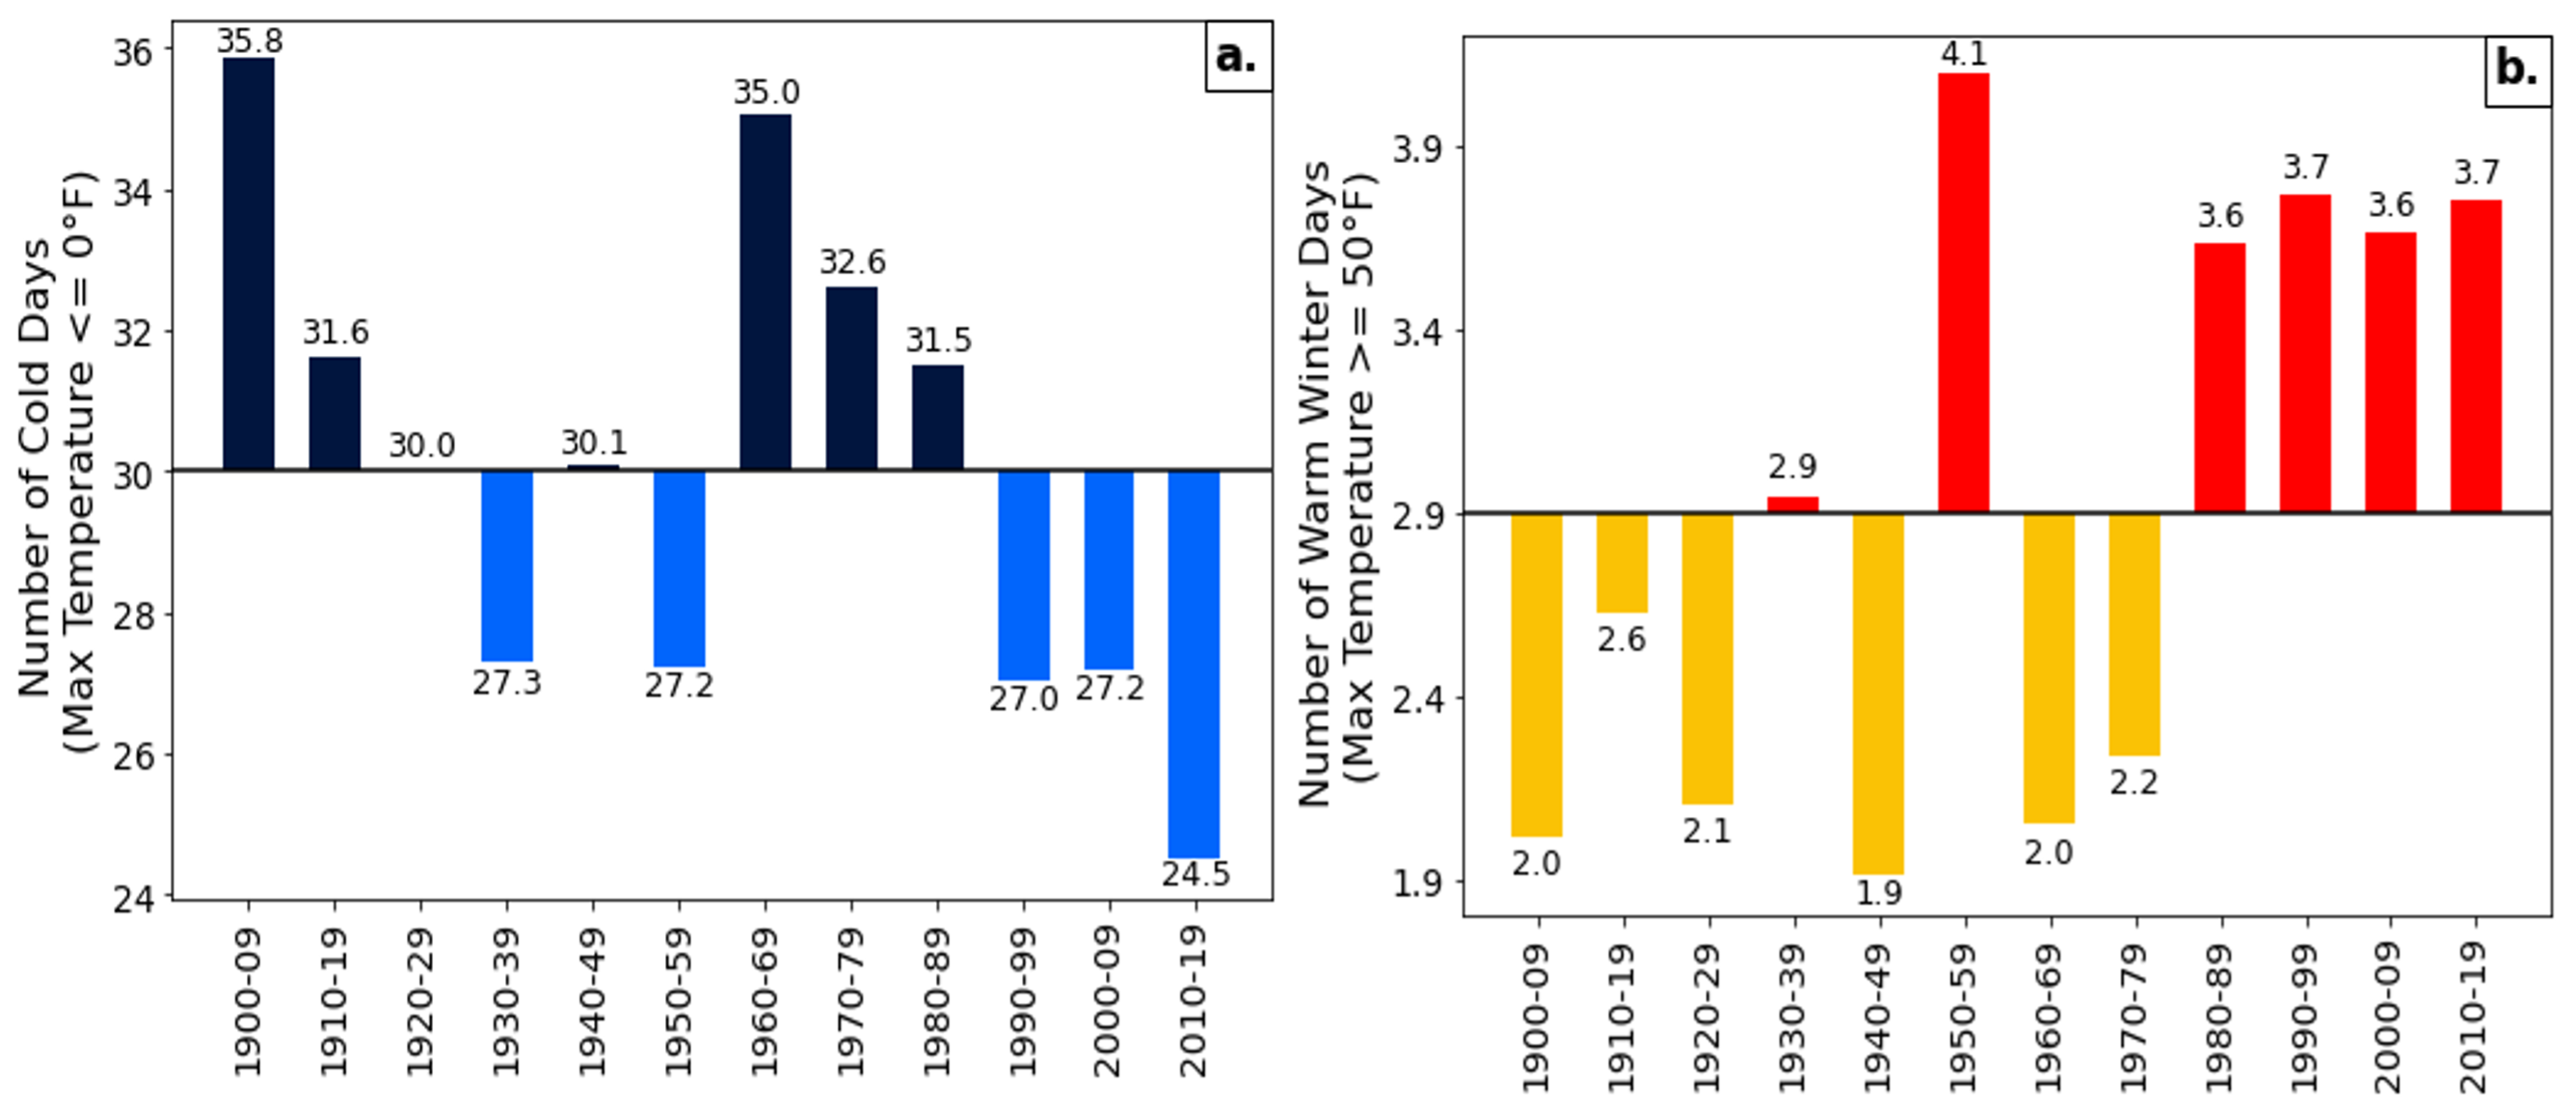
Note: (a) The number of days with minimum temperature below 0ºF. (b) The number of winter days with maximum temperature above 50ºF.
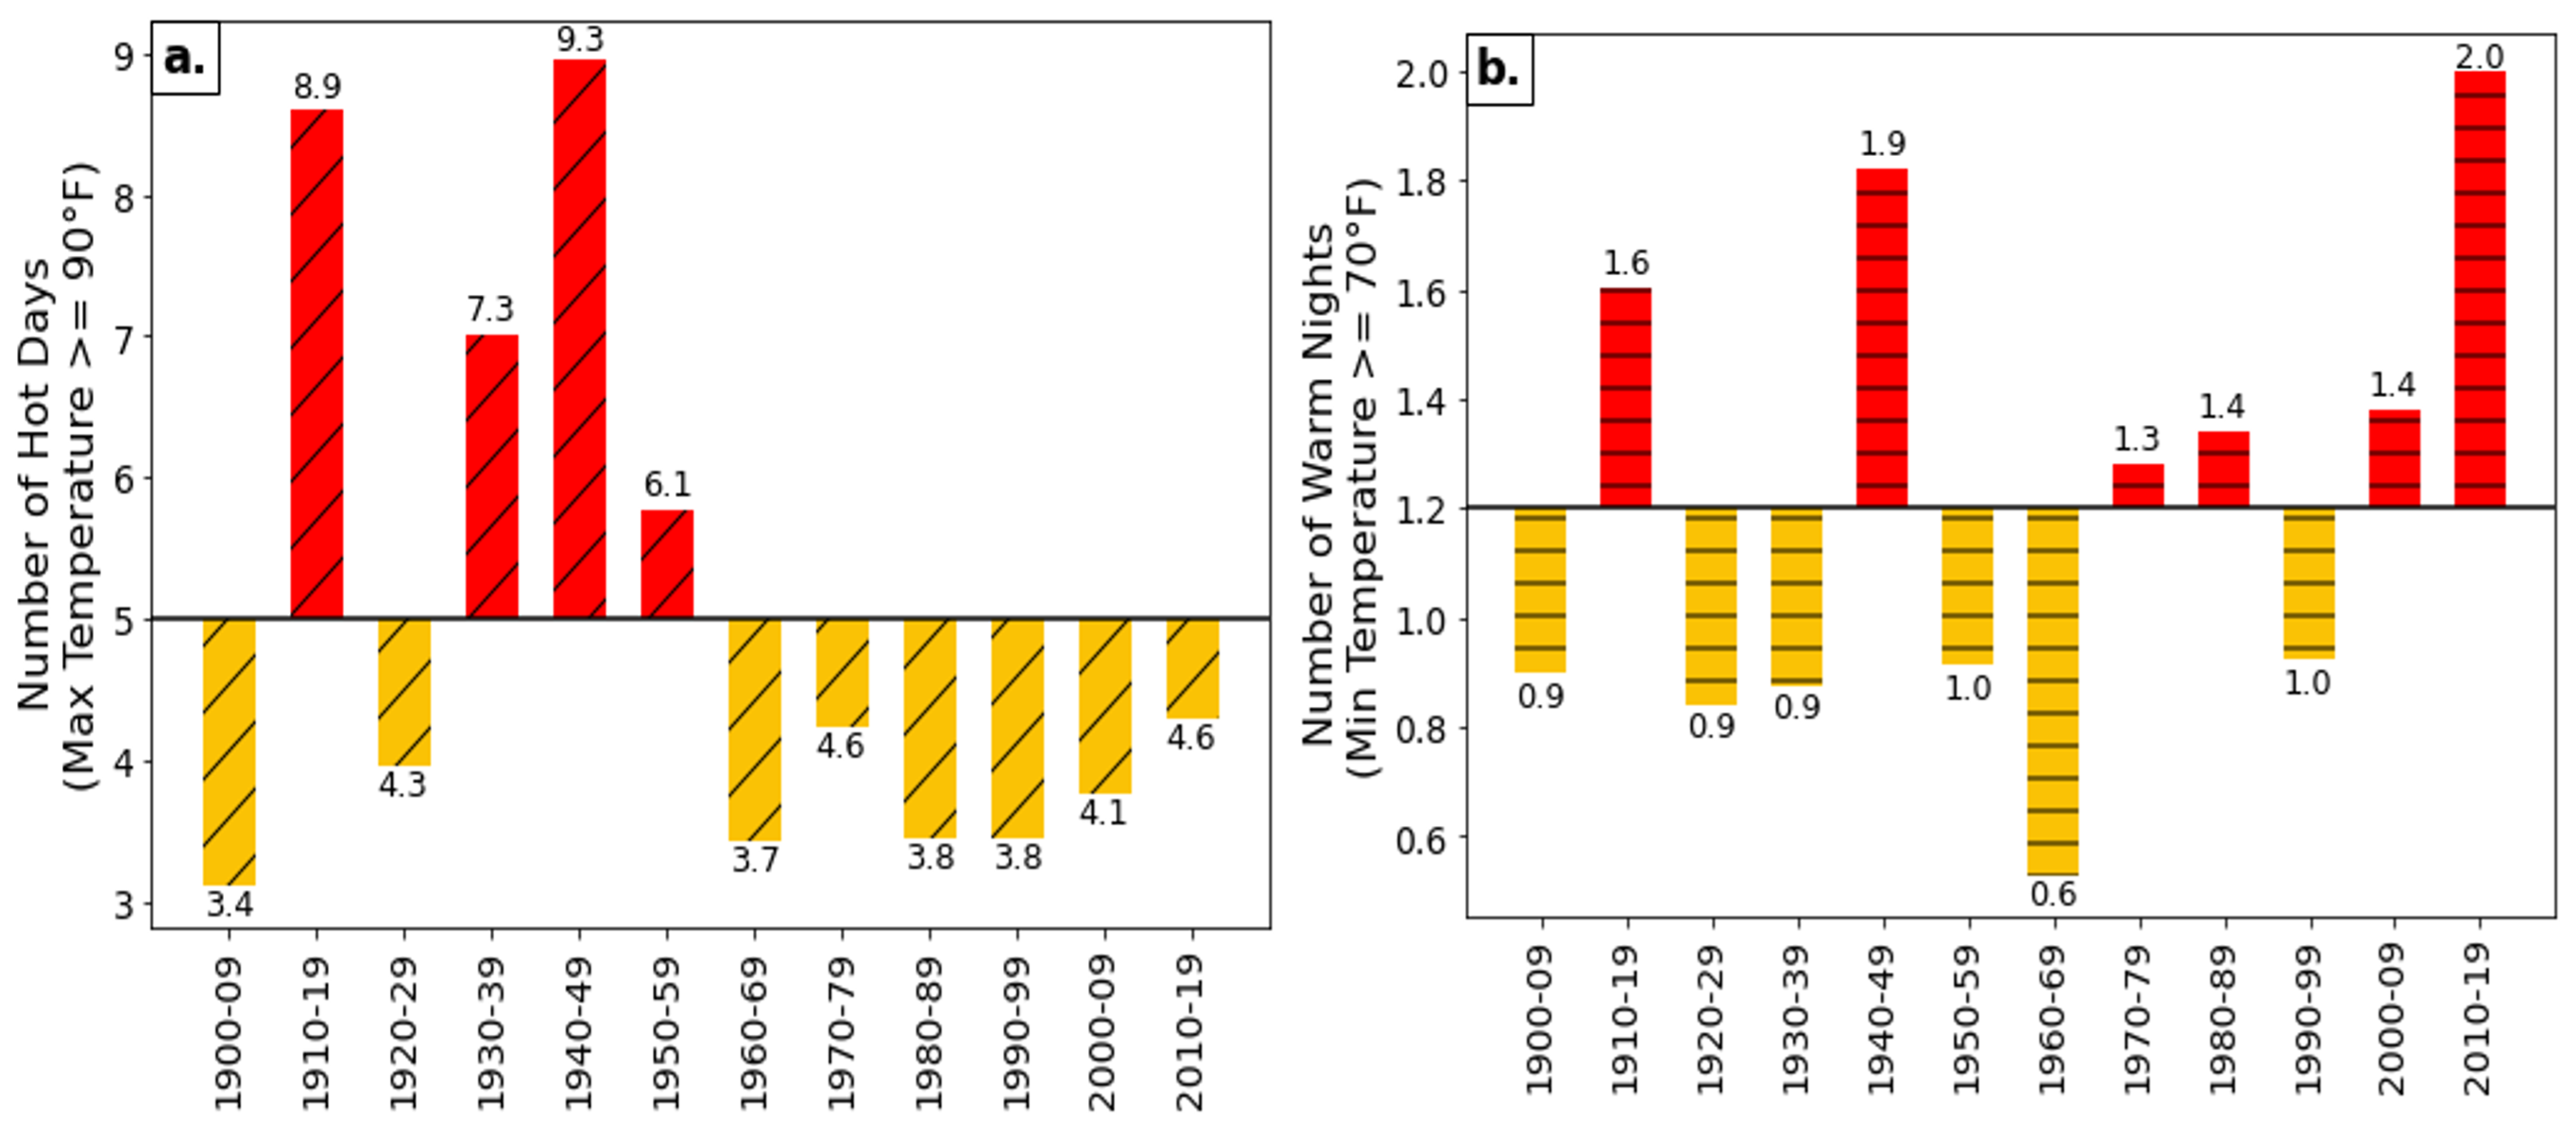
Note: (a) Number of days with maximum temperature above 90ºF (diagonal hash marks) and (b) Number of days with minimum temperature above 70ºF (horizontal hash marks).
1.5 Increasing Precipitation
1.5.1 Average Annual Precipitation
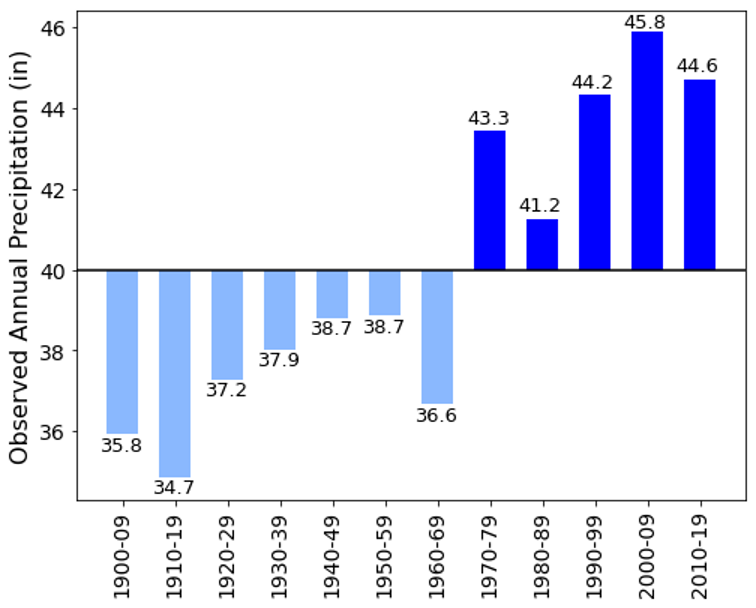
Average annual precipitation in Vermont increased by 21% (7.5 inches) between the early 1900s and 2020, averaging an increase of 1.4 inches per decade since 1960 (Figure 1-8, Table 1-3). Precipitation increases span the four seasons. GCMs project that the Northeast will experience the greatest precipitation rise in winter and spring, yet so far Vermont has experienced the greatest precipitation increase in summer: 2.5 inches since the early 1900s (Table 1-3). Both spring and fall precipitation have increased by 2.4 inches, while winter precipitation has increased by 1.5 inches (Table 1-3). Trends since 1960 also show summer precipitation increasing at the fastest rate, (0.5 inches per decade), while winter and fall precipitation both have increased at similar rates of 0.3 inches per decade. Spring precipitation has increased the slowest, at a rate of 0.2 inches per decade (Table 1-3; Table 1A-3).
Northeastern Vermont has experienced the largest increase in annual precipitation since the early 1900s (26% increase, 9.1 inches), followed by western Vermont (23% increase, 7.3 inches). Southeastern Vermont had the smallest increase (16%, 5.9 inches). Related, average annual precipitation increased twice as fast in northeastern Vermont as in southeastern Vermont (1.2 inches per decade since 1900 in northeastern Vermont as compared to 0.6 inches per decade (0.9 inches per decade in western Vermont; not shown). Precipitation increased slightly faster in higher elevations (stations over 1000 ft) than in lower elevations (1.4 inches per decade since 1960 as compared to 1.2 inches per decade; Regional data available upon request.)
| Trend (per decade) | Total change | |||||
|---|---|---|---|---|---|---|
| 1900–2020 | 1960–2020 | 1991–2020 | Since 1900 | Since 1960 | Since 1991 | |
| Total precipitation (in) | ||||||
| Annual | +0.90* | +1.38* | +0.21 | +7.46 | +6.71 | –0.65 |
| Winter (DJF) | +0.21* | +0.30* | +0.25 | +1.49 | +1.77 | –0.01 |
| Spring (MAM) | +0.19* | +0.21 | –0.02 | +2.36 | +2.11 | +0.38 |
| Summer (JJA) | +0.28* | +0.50* | +0.61 | +2.46 | +2.59 | +0.80 |
| Fall (SON) | +0.25* | +0.34 | –0.40 | +2.44 | +2.44 | –0.74 |
| Days with precipitation above 1 inch (days) | ||||||
| Annual | +0.26* | +0.49* | +0.13 | +1.99 | +2.39 | +0.13 |
| Winter (DJF) | +0.05* | +0.08 | +0.07 | +0.004 | +0.36 | –0.13 |
| Spring (MAM) | +0.06* | +0.11* | +0.03 | +0.58 | +0.76 | +0.13 |
| Summer (JJA) | +0.12* | +0.20* | +0.34 | +1.22 | +1.03 | +0.44 |
| Fall (SON) | +0.05* | +0.11 | –0.09 | +0.48 | +0.48 | –0.12 |
- < -0.5
- -0.5 – 0
- 0 – 0.5
- 0.5 – 2
- 2 – 5
- > 5
Notes: Variables are computed with annual averages using available data for each year. Trend values represent change per decade and those that are bolded and noted by an asterisk (*) are statistically significant to 95% confidence. Total change since 1900 is the difference between the 1900–1909 and 2011–2020 averages, total change since 1960 is the difference between the 1960–1969 and 2011–2020 averages, and total change since 1991 is the difference between the 1991–2000 and 2011–2020 averages. There is no estimate of significance for the total change values. Cells in the table are color-coded based on their value using the key above.
1.5.2 Heavy Precipitation
Heavy precipitation events, defined as more than one inch of precipitation in a day, have grown at a rate of 0.26 days per decade since the early 1900s and 0.5 days per decade since the 1960s (Figure 1-8; Table 1-3). Most of the total increase in the number of heavy precipitation days since the early 1900s has occurred in summer (1.2 days of the total near 2 day increase in the number of annual heavy precipitation days since the early 1900s). Heavy precipitation days have increased by 0.6 and 0.5 days since the early 1900s for spring and fall respectively, and by close to zero days for winter. Since 1960, heavy precipitation days have increased about twice as fast in summer than in other seasons (Table 1.2).
Increased summer precipitation and heavy precipitation events could be due, in part, to an increase in summer thunderstorms, which may be missed in GCMs. Large winter storm systems (e.g., nor’easters) can cover entire states, but thunderstorms are much smaller (10 km). On the other hand, GCMs operate at much larger scales and don’t include the fine-scale dynamics necessary to account for thunderstorms. As a result, it is possible that precipitation projections for the Northeast do not account for the portion of summer precipitation increase that would be due to smaller-scale storm systems like thunderstorms. Local observations of climate also allow for a more in-depth understanding of changing precipitation patterns (in both time and space) within the state of Vermont.
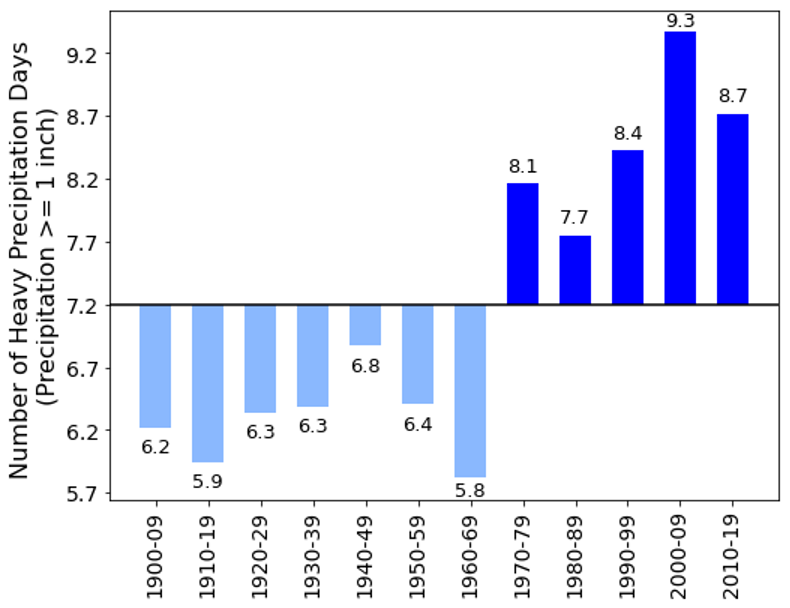
Note: Heavy precipitation events are defined as more than one inch of precipitation. Decadal average values are plotted above and below the 1900–2019 mean value (solid black line). This data is computed for the state of Vermont based on available data for each decade
1.5.3 Snowfall
Average annual snowfall in Vermont increased as precipitation increased over the last century, but snowfall peaked between 1965 and 1979 (a particularly cold period) and has been highly variable since, with some decades reaching eight-to-ten inches above average (Figure 1-9; Table 1-4). Average annual snowfall has increased from an average of 68 inches in 1930–1939 to an average of 86 inches in 2011–2020 (an 18-inch increase), but snowfall has decreased by 10 inches relative to 1960–1969 (which averaged 96 inches; Tables 1-4 and 1A-4). However, this decline in snowfall since the 1960s has occurred at the same time that total winter precipitation has increased, suggesting that the decrease in snowfall is due to warming temperatures rather than drier winters, and that a greater portion of winter precipitation is falling as rain rather than snow.
The greatest increase in annual snowfall (and smallest subsequent decrease) was in northeastern Vermont, where average annual snowfall was 24 inches higher in the 2010–2019 than in 1930–1939 (Table 1-4). The region of northeastern Vermont has experienced the largest increase in annual precipitation and, on average, the coldest temperatures. All regions of Vermont have experienced declines in snowfall since the 1960s, a time with high snowfall relative to the mean from 1930–2020 (Figure 1-9). Southeastern and western Vermont experienced greater declines in snowfall relative to the 1960s compared to northeastern Vermont (Table 1-4). These trends indicate that as the climate continues to warm, annual snowfall is likely to continue to decline because more winter and spring precipitation will fall as rain. Although average annual snowfall is declining, annual snowfall, much like Vermont’s winter temperatures, remains highly variable from year to year. Therefore, while Vermont’s winters may become milder and less snowy on average, any given year could be quite snowy (Betts 2017).
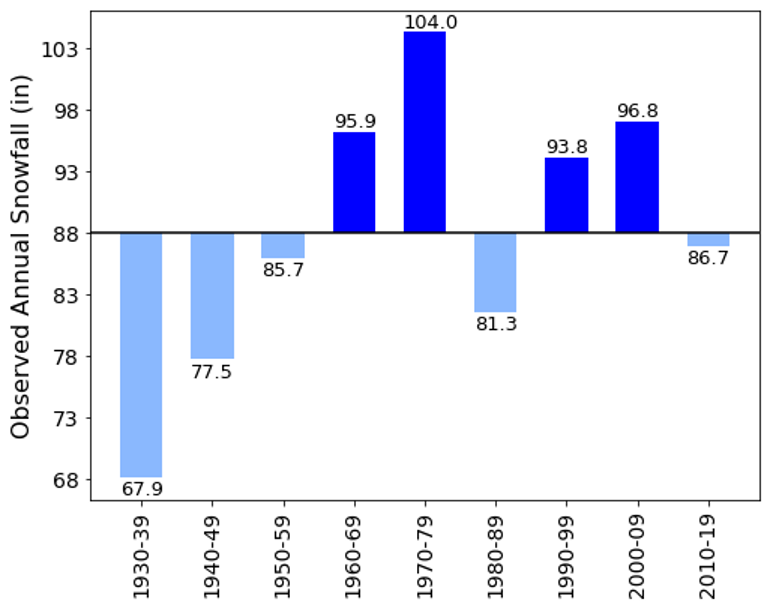
Note: Decadal average values are plotted above and below the 1930–2020 mean value (solid black line). The table is computed based on available data for each decade, 1930–2020. Sufficient snowfall information for more than just the Northeast climate division starts in 1930.
| Trend (inches per decade) | Total change (inches) | |||||
|---|---|---|---|---|---|---|
| 1930–2020 | 1960–2020 | 1991–2020 | Since 1930 | Since 1960 | Since 1991 | |
| Snowfall (inches of snow) | ||||||
| State of VT | +2.1* | –1.8 | –3.7 | +18 | –10 | –11 |
| Northeastern VT | +3.3* | –1.0 | –3.3 | +24 | –9 | –10 |
| Western VT | +2.1 | –1.6 | –5.5 | +17 | –12 | –13 |
| Southeastern VT | — | –3.5 | –4.8 | — | –17 | –10 |
| Winter precipitation (inches of liquid equivalent) | ||||||
| State of VT | +1.0* | +0.3* | +0.3 | +1.1 | +1.8 | –0.01 |
| Northeastern VT | +1.4* | +0.2 | +0.01 | +1.5 | +1.8 | –0.5 |
| Western VT | +0.7* | +0.4* | +0.7* | +1.1 | +1.9 | +0.6 |
| Southeastern VT | +0.4 | +0.3* | +0.2 | +0.6 | +1.7 | –0.3 |
- < -10
- -10 – 5
- -5 – 2
- -2 – -.05
- -.05 – 0
- 0 – 0.5
- 0.5 – 2
- 2 – 5
- > 5
Note:Trend values represent change per decade and those that are bolded and noted by an asterisk (*) are statistically significant to 95% confidence. Total change since 1930 is the difference between the 1930–1939 and 2011–2020 averages, total change since 1960 is the difference between the 1960–1969 and 2011–2020 averages, and total change since 1991 is the difference between the 1991–2000 and 2011–2020 averages. Total change values are not assessed for significance. Cells are color-coded based on their value using the key above. Computed on annual averages using available data for each year, starting in 1930 when there were consistent snowfall observations for northeastern and western climate divisions. Snowfall observations began in 1946 for southeastern Vermont, so the 1930s are omitted in that section.
1.6 Climate Indicators
A series of climate indicators related to changes in precipitation and temperature trends are considered in this section. These climate indicators—including length of freeze-free period and the timing of the ice-out of lakes and ponds—affect how and when Vermonter’s experience life, from planting of food crops to winter recreation.
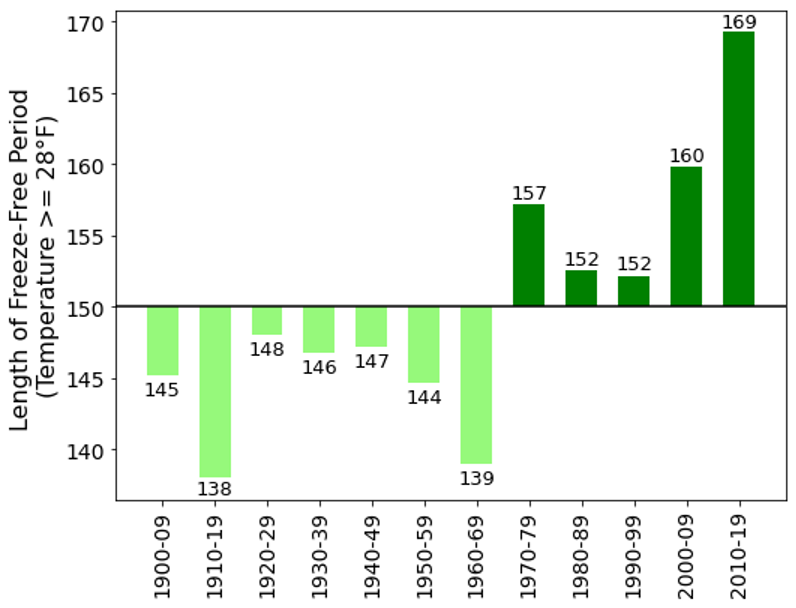
1.6.1 Freeze-free Period
As temperatures in Vermont have warmed, the freeze-free period has lengthened. We define the freeze-free period as the number of consecutive days with a minimum temperature above 28ºF. This temperature threshold represents a hard freeze, an important factor for food production in Vermont (see Agriculture and Food Systems chapter). Since 1900, the length of the freeze-free period for the state of Vermont has increased at a rate of 1.7 days per decade, which accelerated to 4.4 days per decade since 1960 and and again to 9.0 days per decade since 1991 (Table 1-5; Figure 1-11). Southeastern Vermont has experienced the greatest change: from 136 freeze-free days in 1900 to 166 days in 2010s (Table 1A-5), with very rapid change since the early 1900s and early 1960s. Since 1991, northeastern Vermont has the most accelerated change in length of freeze-free period at 9.6 days/decade (Table 1.4).
| Freeze-free period | Trend (days per decade) | Total change (days) | ||||
|---|---|---|---|---|---|---|
| 1900–2020 | 1960–2020 | 1991–2020 | Since 1900 | Since 1960 | Since 1991 | |
| State of VT | +1.7* | +4.4* | +9.0* | +21 | +28 | +16 |
| Northeastern VT | +1.3* | +4.2* | +9.6* | +18 | +28 | +18 |
| Western VT | +0.6 | +2.4* | +5.5* | –2 | +16 | +10 |
| Southeastern VT | +2.4* | +6.4* | +8.2* | +30 | +37 | +17 |
- < 0
- 0 – 5
- 5 – 15
- 15 – 25
- > 25
Note: Trend values that are noted by an asterisk (*) are statistically significant to 95% confidence. Total change since 1900 is the difference between the 1900–1909 and 2011–2020 averages, since 1960 is the difference between the 1960–1969 and 2011–2020 averages, and since 1991 is the difference between the 1991–2000 and 2011–2020 averages.
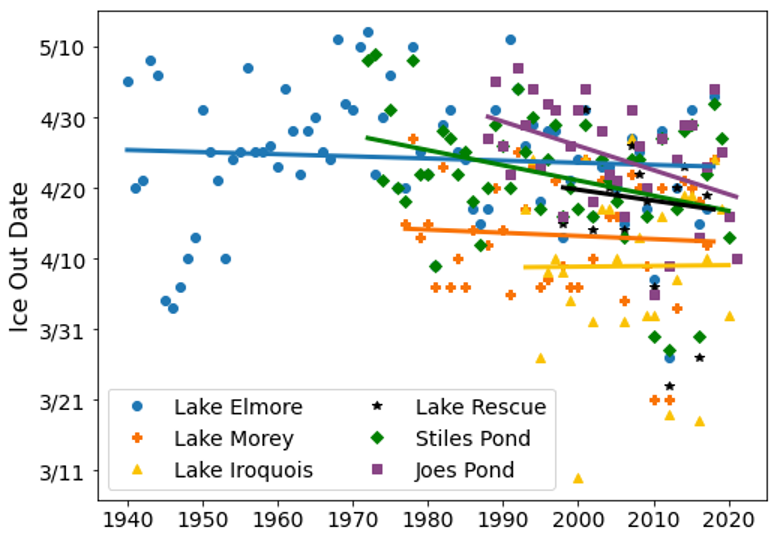
1.6.2 Ice-out on Vermont Lakes and Ponds
The day the ice melts off local ponds and lakes —the ice-out date— is noted by many Vermonters. Some take it as a sign of warmer days ahead, others mark it as the end of the ice recreation season, although ice is unstable long before it melts completely. While the definition of ice-out varies by water body, the ice-out date is generally when there is no longer full ice cover on a lake or pond. Ice-out dates have been used as a key climate change indicator. Ice-out dates reflect both the average winter and early spring temperatures as well as the timing and speed of the onset of spring. Earlier ice-out dates may reflect warmer average temperatures or an earlier, more rapid onset of spring, whereas later ice-out dates may reflect colder temperatures on average, or a later, more gradual onset of spring.
Many lakes and ponds in Vermont have ice-out records, usually through the efforts of citizen scientists. Some citizen groups use the ice-out date to run raffles: for example, the Joe’s Pond Association sells tickets to guess the date and time, with the winner taking half the proceeds and the other half going to the annual 4th of July celebration. These citizen groups use simple and consistent methods that make for good long-term records of ice-out across Vermont.
In this research effort, six lakes and ponds across Vermont were assessed for ice-out trends using an ordinary least squares regression (Figure. 1-12; Table 1-6): Lake Elmore (northeastern Vermont), Stiles Pond (northeastern Vermont), Lake Morey (northeastern Vermont), Joe’s Pond (northeastern Vermont), Lake Iroquois (western Vermont), and Lake Rescue (southeastern Vermont). Five of the six lakes and ponds analyzed trend toward earlier ice-out dates, meaning that winter conditions that maintain ice-covered water bodies are likely being impacted by trends in winter temperatures (Figure 1.5; Table 1-2). For example, Joe’s Pond in West Danbury, Vermont has seen ice out shift earlier at a rate of 3.4 days/decade since 1988 and Stiles Pond in Waterford, Vermont, has also seen earlier ice-out at a rate of 2.1 days/decade since 1971 (Table 1-6). Earlier ice-out dates not only impact winter recreation (i.e., ice sports; see Recreation and Tourism chapter) but also impact fish and wildlife (see Fisheries and Wildlife chapter) and the amount of discharge from rivers during the melt-season (see Water Resources chapter).
| Lake Elmore Elmore, VT | Lake Morey Fairlee, VT | Lake Iroquois Chittenden County, VT | Lake Rescue Ludlow, VT | Site Pond Waterford, VT | Joe’s Pond West Dandville, VT | |
|---|---|---|---|---|---|---|
| Period of record | 1940–2018 | 1977–2018 | 1993–2020 | 1998–2018 | 1972–2020 | 1988–2021 |
| Trend (days/decade) | –0.3 | –0.4 | +0.01 | –0.2 | –2.1* | –3.4* |
Note: Values noted by an asterisk (*) are statistically significant to 95% confidence. Sources of data:
1 Town of Elmore, 2021; 2 Town of Fairlee, 2021;3 Lake Iroquois Association, 2021;4 Lake Rescue Association, 2020;
5 Data courtesy of Mark Breen, Eye on the Sky, Fairbanks Museum, St. Johnsbury, VT; 6 Joe’s Pond Association, 2021.
Box 1.1: Vermont Winter Trends: Snow Cover, Ice-Out, and Winter Gardening
Contributor: Alan K. Betts, Atmospheric Research, Pittsford, Vermont
Amongst the climate changes apparent in Vermont, I find warming winters to be the most significant because winter temperatures are coupled to declining snow cover. Days without reflection of sunlight by snow are discontinuously warmer than days with snow (Betts and Desjardins, 2018).Historically, most of Vermont was classified in climate zone 4, which corresponds to average winter minimum temperatures in the range -20oF (-29oC) to 30oF (-34oC). These minimums have risen at least 10oF in the past twenty years. This hastens ice out on lakes and ponds in spring and delays freeze-up in fall. This has been accurately monitored for Stiles Pond by the Fairbanks Museum for fifty years. Figure 1.12 shows ice-out, freeze-up, and length of frozen period.
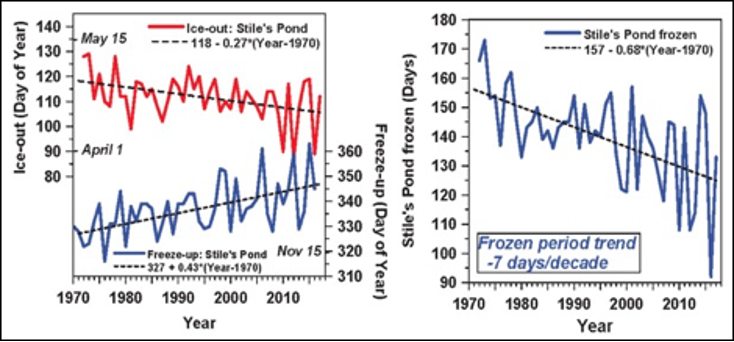
The seven-day per decade trend towards a shorter frozen winter period is clear, but the interannual variability in the frozen period is now as large as the 46-year change in the trend line shown.
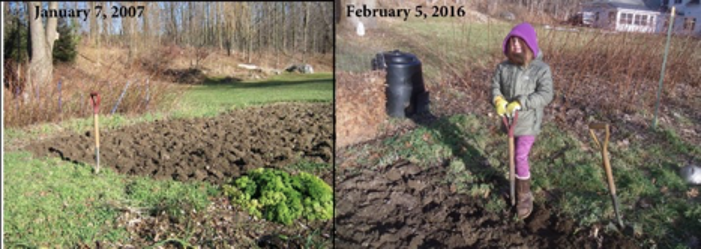
In Rutland County, I have planted a rye cover crop for 40 years. In the 1980s, the ground was solidly frozen all winter. By the early 2000s, the ground was often unfrozen into December. Figure 1-14 shows January 7, 2007 (left) the first January date that I was able to dig under my well-grown cover crop (left) after record temperatures in December; 2008 was similar. In 2012 the ground was frozen only 67 days (January 3 to March 10), and in 2013 the ground was unfrozen till mid-January. In the 2016 photo on the right of my granddaughter digging rye (Figure 1-14), a record was set because the ground was still unfrozen on February 5. There were unfrozen periods in January, February and March of 2017; 2018 was unfrozen into January, and 2020 was again unfrozen into February.
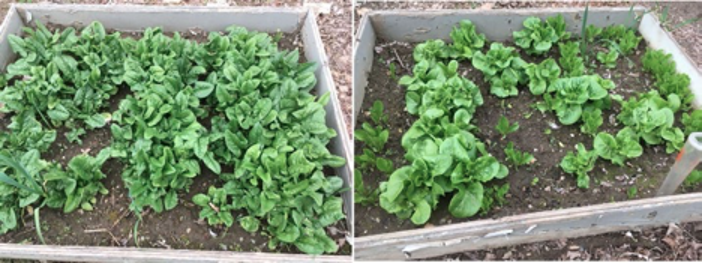
Winter gardening has transformed in a little over a decade, as soil temperatures have crossed the critical frozen-unfrozen threshold. Hardy crops like spinach and lettuce can be wintered over in glass-covered cold frames to give fresh vegetables in spring. Figure 1-15 shows these on April 20, 2021, with 8-in tall spinach (left) and buttercrunch lettuce heading up (right) together with smaller lettuce planted later in December.
1.7 Extreme Events
Climate change is expected to increase the variability in climate extremes. While some of the impacts of climate change on atmospheric, oceanic, and land-surface processes are known, the interactions of the changes across different spheres over time are less clear, since the climate will move in and out of historically rare climate states (Betts 2017). Extreme events can happen in Vermont in all seasons and include (but are not limited to): heavy precipitations (from tropical cyclones, severe thunderstorms) and variability in related events like flooding, heavy snowfall, ice storms, and drought.
1.7.1 Flooding
Flooding in Vermont can be caused by heavy precipitation (from tropical cyclones, winter storms, or severe thunderstorms) in all seasons or ice-jam flooding in the winter and spring. The most massive recent flooding event in Vermont was caused by Tropical Storm Irene on 28 August 2011; it resulted in an estimated $733 million dollars of damage and three fatalities (Runkle et al. 2017). In addition to the 4–8 inches of rain produced by Irene, existing high levels of soil moisture due to earlier heavy rain events in 2011 meant that much of Irene’s record-breaking rainfall could not infiltrate into the soil and instead ran off the landscape directly into rivers. The heavy rains and large amount of runoff contributed to substantial flooding across the state, second only to the flooding caused by the Great Flood of 1927 (Preliminary Hurricane/Tropical Storm Irene Weather Summary for the North Country n.d.; Top 5 Weather Events of 2011 across the North Country n.d.). More recently, the Halloween storm of 2019 produced 3–5 inches of rain in a single day, broke multiple precipitation and temperature records, led to extensive flooding, and caused over $6 million dollars of damage to infrastructure across the state (Hastings and Taber 2019; President Signs Disaster Declaration for Halloween Storm 2020). Ice-jams are a principal mechanism for winter flooding in Vermont. Ice-jams occur when warm temperatures, snowmelt, and rainfall cause ice in rivers to break up rapidly. This newly mobile ice accumulates and creates a dam, or ice-jam, causing water behind the ice-jam to rise, often topping riverbanks and filling floodplains. For example, from 12–14 January 2018, a combination of record warmth, record atmospheric moisture, a deep existing snowpack, and rains of 0.5– 2 inches led to ice-jams caused by rapid breaking up of river ice and resulted in flooding along the Missisquoi, Lamoille, and Winooski Rivers in Vermont (The Widespread Ice Jam Flooding and Wintry Mixed Precipitation Event on January 12-13, 2018 n.d.).
1.7.2 Dry Spells and Droughts
Drought events in Vermont range from severe multi-year droughts that impact the entire state, to shorter lived, more frequent, localized events (Dupigny‐Giroux 2001). The impacts of drought events can be far-reaching, affecting agriculture, water resources, forestry, and tourism in the state (Dupigny‐Giroux 2001). Since the inception of the U.S. Drought Monitor (USDM) in 2000 (Svoboda et al. 2002), Vermont has experienced several significant droughts (Table 1-7). Vermont’s longest drought since the start of this record lasted forty-five weeks (21 July 2016 to 25 April 2017), during which conditions ranged from moderately to exceptionally dry, or D1-D4 in the USDM drought classification (Drought in Vermont from 2000-Present n.d.). More recently, Vermont experienced its most intense drought since the start of the USDM during the week of 29 September 2020, when severe drought conditions, D2 in the USDM classification, impacted 29.39% of the state. Extended periods with little-to-no precipitation and above-average summer temperatures (+6.2ºF in Burlington, Vermont) resulted in the lowest seven-day average streamflow in September 2020 in 30 years for fourteen USGS streamflow gauges across New England (seven of which were in Vermont) (Figure 1-16; Lombard et al. 2021). Other notable droughts in the state occurred in 1930–1936, 1939–1943, 1960–1969, 1980–1981, 1988–1989, 1991, 1995, 1998, 2001-2002 (Dupigny‐Giroux 2001, Table 1.6; Dupigny-Giroux 2002; Lombard et al. 2021).
| Year | Months in which states were severely affected by drought, defined as 30-year lows at more than 10 percent of sites |
|---|---|
| 1991 | June and July |
| 1995 | June to September |
| 1998 | May (Maine, New Hampshire, Vermont) |
| 1999 | June to August |
| 2001 | August to September |
| 2002 | August to September |
| 2016 | June to August |
| 2020 | June and September |
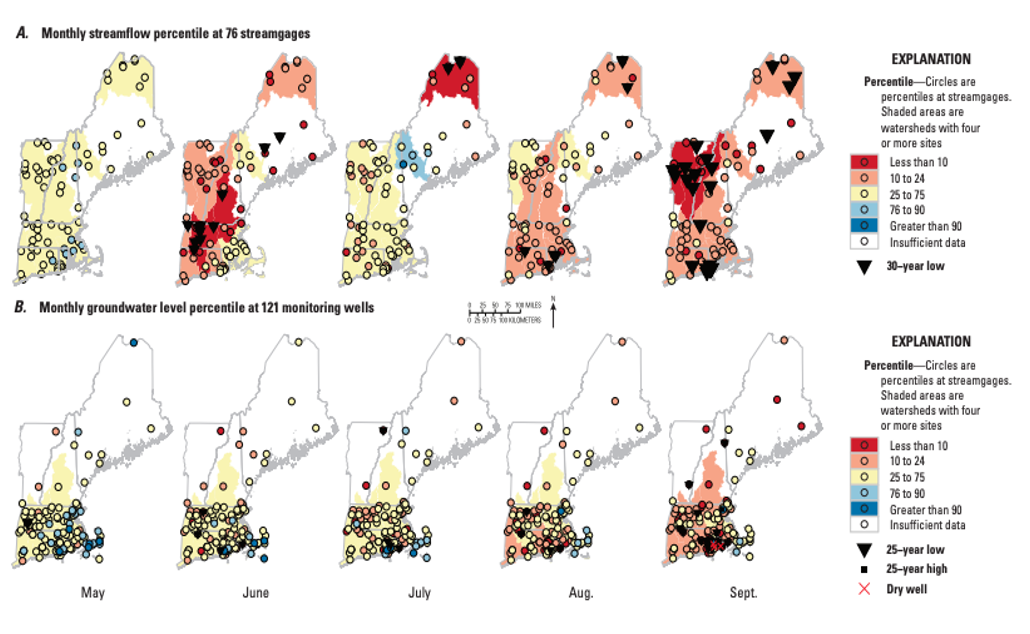
Note: Watersheds are based on the six-digit hydrologic unit code boundaries from U.S. Environmental Protection Agency and U.S. Geological Survey (2012). Watersheds with four or more sites are shaded according to the mean percentile across those sites. (Lombard et al., 2021; their Fig. 5)
1.8 Traceable Accounts
Traceable accounts describe the confidence level—the degree of certainty in the scientific evidence—for each key message resulting from this chapter. This analysis is based on the U.S. Global Change Research Program guidance in the 4th National Climate Assessment (USGCRP, 2018).
Confidence Level
- Very High – Strong evidence (established theory, multiple sources, confident results, well-documented and accepted methods, etc.), high consensus
- High – Moderate evidence (several courses, some consistency, methods vary, and/or documentation limited, etc.), medium consensus
- Medium – Suggestive evidence (a few sources, limited consistency, models incomplete, methods emerging, etc.), competing schools of thought
- Low – Inconclusive evidence (limited sources, extrapolations, inconsistent findings, poor documentation and/or methods not tested, etc.), disagreement or lack of opinions among experts
Key Message 1
Vermont’s annual average temperature has increased by almost 2°F (1.11°C) since 1900. Winter temperatures have increased 2.5 times faster than annual temperatures over the past sixty years, and the number of very cold nights has decreased by over seven days in the same time period.
- Description of evidence base: Evidence for increasing long-term trends in temperature across Vermont were assessed using data from eighteen U.S. Cooperative Observer Network weather stations from 1888 to 2020.
- Major uncertainties: Differences in the locations of stations (i.e., elevation, proximity to water body, land-use around station) mean that individual locations may be impacted by changes in temperature differently.
- Description of confidence and likelihood: There is very high confidence that Vermont’s temperatures have been and will continue to increase, especially in winter.
Key Message 2
Average annual precipitation in Vermont has increased by 21% since 1900. Annual snowfall has been decreasing since a peak in the 1960s–70s, even as total winter precipitation has increased over the same time period, suggesting that more winter precipitation may be falling as rain.
- Description of evidence base: Evidence for increasing long-term trends in precipitation across Vermont were assessed using data from eighteen U.S. Cooperative Observer Network weather stations from 1888 to 2020.
- Major uncertainties: While climate models for the Northeast United States project the greatest increases in winter and spring precipitation, historical records for Vermont show the fastest increase in summer precipitation. While annual snowfall for the last decade is still higher than in the earliest measurements, snowfall appears to have been declining since a peak in the 1960s-70s.
- Description of confidence and likelihood: There is very high confidence that Vermont’s precipitation has been and will continue to increase, and high confidence that more winter precipitation is falling as rain.
Key Message 3
The length of the average freeze-free period is three-weeks longer now than the beginning of the twentieth century, and the rate of increase has accelerated in recent decades.
- Description of evidence base: Evidence for long-term trends in the length of the freeze-free period across Vermont were assessed using data from eighteen U.S. Cooperative Observer Network weather stations from 1888 to 2020.
- Major uncertainties: Differences in the location of stations across the state (i.e., elevation, proximity to water body, land use around a station) may impact changes in the length of the freeze-free period differently.
- Description of confidence and likelihood: There is very high confidence that the length of the freeze-free period has increased in Vermont and will continue to increase.
Key Message 4
Lakes and ponds across Vermont are icing-out one-to-three days earlier per decade as compared to the 1970s and 1980s.
- Description of evidence base: Evidence for ice-out on lakes and ponds across Vermont comes from data produced by citizen science organizations.
- Major uncertainties: Ice-out definitions differ slightly by location meaning that directly comparing trends from different lakes and ponds across Vermont is difficult.
- Description of confidence and likelihood: There is very high confidence that ice-out on Vermont’s lakes and ponds is occurring earlier.
Key Message 5
Extreme weather events, such as droughts and floods, significantly impact Vermont. There are now 2.4 more days of heavy precipitation in the average year than in the 1960s. This increase has been happening about twice as fast in summer as in the other seasons.
- Description of evidence base: Evidence for the increase in heavy precipitation events in Vermont were assessed by using data from U.S. Cooperative Observer Network weather stations from 1888 to 2020.
- Major uncertainties: Much of the evidence for extreme events (i.e., droughts, tropical cyclones, floods) is anecdotal and localized, which makes trend analysis difficult. For example, systems that produce heavy precipitation events (greater than one inch) must pass directly over an observation site to be recorded.
- Description of confidence and likelihood: There is very high confidence that heavy precipitation events are increasing in Vermont, due to the consistency of trends in these events across all observation sites. There is high confidence that extreme events will increase in Vermont.
1.9 Appendix to Chapter 1
| Station | Latitude | Longitude | Elevation (ft) | Climate division | Period of record |
|---|---|---|---|---|---|
| Barre Montpelier Knapp State Airport | 44.2035 | -72.5623 | 1125.98 | Northeastern | 1949–2020 |
| Burlington International Airport | 44.4683 | -73.1499 | 330.05 | Western | 1941-2020 |
| Cavendish | 43.3847 | -72.5988 | 842.00 | Southeastern | 1904–2012 |
| Cornwall | 43.9573 | -73.2106 | 345.14 | Western | 1893–2020 |
| Enosburg Falls* | 44.9094 | -72.8082 | 419.95 | Northeastern | 1892–2020 |
| Gilman | 44.4112 | -71.7186 | 839.90 | Northeastern | 1931–2020 |
| Island Pond | 44.8128 | -71.8902 | 1200.13 | Northeastern | 1991–2020 |
| Mount Mansfield | 44.5248 | -72.8154 | 3950.13 | Northeastern | 1955–2020 |
| Newport | 44.949 | -72.1912 | 790.03 | Northeastern | 1931–2020 |
| Northfield | 44.1647 | -72.6567 | 669.95 | Northeastern | 1888–2017 |
| Peru | 43.26271 | -72.90553 | 1700.13 | Western | 1941–2020 |
| Rochester | 43.8578 | -72.8044 | 830.05 | Northeastern | 1929–2020 |
| Rutland | 43.6253 | -72.9781 | 620.08 | Western | 1917–2020 |
| Saint Johnsbury | 44.42 | -72.0194 | 700.13 | Northeastern | 1895–2020 |
| South Hero | 44.6264 | -73.303 | 109.91 | Western | 1970–2019 |
| South Lincoln | 44.0725 | -72.9736 | 1340.88 | Western | 1982–2020 |
| Union Village Dam | 43.7917 | -72.2578 | 459.97 | Southeastern | 1951–2020 |
| West Burke / Sutton* | 44.6122 | -72.0481 | 1500.00 | Northeastern | 1931–2020 |
| Woodstock | 43.6303 | -72.5072 | 600.07 | Southeastern | 1893–2020 |
Note: Station names with an asterisk indicate stations that moved location at some point in their period of record. Current location is provided in the table.
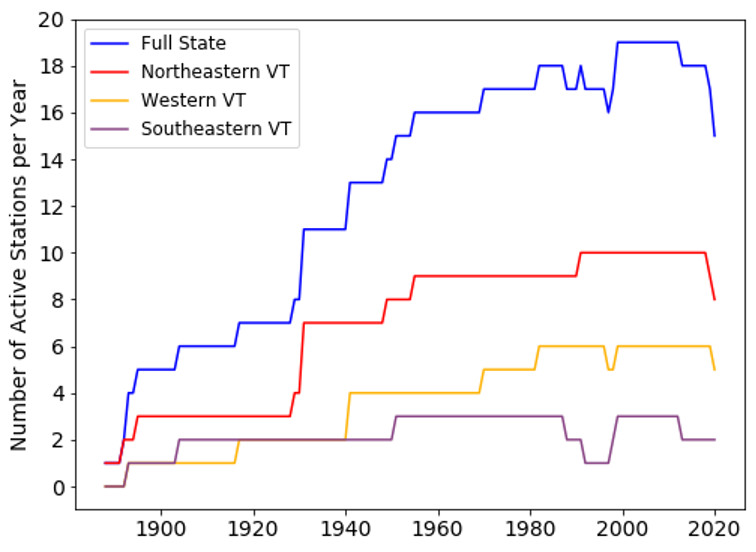
Note: This number depends on the amount of data available each year as well as if a station was active or not (see Table A1 for each station’s period of record).
| Average temperature (°F) | Decadal mean value | |||
|---|---|---|---|---|
| 1900 – 1909 | 1960 – 1969 | 1991 – 2000 | 2011 – 2020 | |
| Annual | 42.1 | 42.6 | 43.0 | 44.1 |
| Winter (DJF) | 17.4 | 17.7 | 19.8 | 20.7 |
| Spring (MAM) | 41.3 | 40.5 | 41.1 | 41.4 |
| Summer (JJA) | 64.7 | 64.3 | 65.2 | 66.2 |
| Fall (SON) | 46.0 | 46.6 | 45.8 | 47.6 |
| Avg. Max. T. (°F) | 53.4 | 53.4 | 53.6 | 54.5 |
| Avg. Min. T. (°F) | 30.9 | 31.1 | 32.4 | 33.7 ± 1.3 |
| Days with Max. T. > 90°F (days) | 3.4 | 3.8 | 3.6 | 4.9 |
| Days with Min. T. > 70°F (days) | 0.9 | 0.6 | 0.9 | 2.1 |
| Days with Max. T. < 0°F (days) | 35.8 | 35.0 | 29.0 | 25.0 |
| Winter Days with Max. T. > 50°F (days) | 2.0 | 2.02 | 4.0 | 3.8 |
| Decadal mean value | ||||
|---|---|---|---|---|
| 1900 – 1909 | 1960 – 1969 | 1991 – 2000 | 2011 – 2020 | |
| Total precipatacion (in) | ||||
| Annual | 35.8 | 36.6 | 43.9 | 43.3 |
| Winter (DJF) | 7.3 | 7.0 | 8.8 | 8.8 |
| Spring (MAM) | 8.5 | 8.7 | 10.4 | 10.8 |
| Summer (JJA) | 11.1 | 11.0 | 12.8 | 13.6 |
| Fall (SON) | 8.4 | 9.6 | 11.6 | 10.9 |
| Days with precipitation above 1 inch (days) | ||||
| Annual | 6.2 | 5.8 | 8.0 | 8.2 |
| Winter (DJF) | 1.1 | 0.7 | 1.2 | 1.1 |
| Spring (MAM) | 1.2 | 1.0 | 1.7 | 1.8 |
| Summer (JJA) | 2.0 | 2.1 | 2.7 | 3.2 |
| Fall (SON) | 1.7 | 1.7 | 2.3 | 2.2 |
| Observed snowfall (inches of snow) | Decadal mean value | |||
|---|---|---|---|---|
| 1930 – 1939 | 1960 – 1969 | 1991 – 2000 | 2011 – 2020 | |
| State of VT | 68 | 96 | 96 | 86 |
| Northeastern VT | 73 | 105 | 106 | 97 |
| Western VT | 54 | 82 | 83 | 71 |
| Southeastern VT | — | 90 | 84 | 74 |
| Lenght of freeze-free period (days) | Decadal mean value | |||
|---|---|---|---|---|
| 1900 – 1909 | 1960 – 1969 | 1991 – 2000 | 2011 – 2020 | |
| State of VT | 145 | 139 | 150 | 166 |
| Northeastern VT | 143 | 132 | 142 | 160 |
| Western VT | 178 | 160 | 165 | 176 |
| Southeastern VT | 136 | 129 | 149 | 166 |
1.10 Acknowledgements
We acknowledge the helpful comments and suggestions on this work from Peter Banacos, Paul Sission, and Marlon Verasamy from the National Weather Service in Burlington, Vermont and from Alan Betts. We also acknowledge Mark Breen from the Fairbanks Museum in Saint Johnsbury for providing ice-out data for Stiles Pond.
1.11 References
Baxter, M. A., Graves, C. E., & Moore, J. T. (2005). A Climatology of Snow-to-Liquid Ratio for the Contiguous United States. Weather and Forecasting, 20(5), 729–744. https://doi.org/10.1175/WAF856.
Betts, A. K. (2017). Climate Change in Vermont. Vermont Climate Change Report for the Governor’s Vermont Climate Action Commission. DOI:10.13140/RG.2.2.30544.81920
Betts, A. K., & Desjardins, R. L. (2018). Understanding Land–Atmosphere–Climate Coupling from the Canadian Prairie Dataset. 27
DeGaetano, A. T., Noon, W., & Eggleston, K. L. (2015). Efficient Access to Climate Products using ACIS Web Services. Bulletin of the American Meteorological Society, 96(2), 173–180. https://doi.org/10.1175/BAMS-D-13-00032.
Drought in Vermont from 2000-Present. (n.d.). National Integrated Drought Information System. Retrieved March 12, 2021, from https://www.drought.gov/states/vermont#:~:text=Drought%20in%20Vermont&text=The%20U.S.%20Drought%20Monitor%20started,affected%2029.39%25%20of%20Vermont%20lan
Dupigny‐Giroux, L. (2001). Towards Characterizing and Planning for Drought in Vermont‐Part I: A Climatological Perspective 1. JAWRA Journal of the American Water Resources Association, 37(3), 505–525. https://doi.org/10.1111/j.1752-1688.2001.tb05489.
Dupigny-Giroux, L.-A. (2002, February 21). The 2001-2002 Drought in Vermont. The 2001-2002 Drought in Vermont. http://www.uvm.edu/~vtstclim/drought_vermont.htm
Dupigny-Giroux, L.-A., Mecray, E., Lemcke-Stampone, M., Hodgkins, G. A., Lentz, E. E., Mills, K. E., Lane, E. D., Miller, R., Hollinger, D., Solecki, W. D., Wellenius, G. A., Sheffield, P. E., MacDonald, A. B., & Caldwell, C. (2018). Chapter 18: Northeast. Impacts, Risks, and Adaptation in the United States: The Fourth National Climate Assessment, Volume II. U.S. Global Change Research Program. https://doi.org/10.7930/NCA4.2018.CH1
Guttman, N. B., & Quayle, R. G. (1995). A Historical Perspective of U.S. Climate Divisions. Bulletin of the American Meteorological Society, 12
Hastings, M., & Taber, B. (2019, December 12). The Halloween 2019 Significant Flooding and High Wind Event. National Weather Service. https://www.weather.gov/btv/The-Halloween-2019-Significant-Flooding-and-High-Wind-Even
Hayhoe, K., Wuebbles, D. J., Easterling, D. R., Fahey, D. W., Doherty, S., Kossin, J. P., Sweet, W. V., Vose, R. S., & Wehner, M. F. (2018). Chapter 2: Our Changing Climate. Impacts, Risks, and Adaptation in the United States: The Fourth National Climate Assessment, Volume II. U.S. Global Change Research Program. https://doi.org/10.7930/NCA4.2018.CH
Hussain, Md., & Mahmud, I. (2019). pyMannKendall: A python package for non parametric Mann Kendall family of trend tests. Journal of Open Source Software, 4(39), 1556. https://doi.org/10.21105/joss.0155
IPCC. (2014). Climate Change 2014: Synthesis Report. Contribution of Working Groups I, II and II to the Fifth Assessment Report of the Intergovernmental Panel on Climate Change (p. 151). IPCC. https://ar5-syr.ipcc.ch/topic_futurechanges.ph
Joe’s Pond Association. (2021). Joe’s Pond Ice Out. Joe’s Pond Vermont. https://www.joespondvermont.com/ice-out.htm
Kendall, M. G. (1975). Rank correlation methods. Oxford University Press
Lake Iroquois Association. (2021). Ice Out on Lake Iroquois. Lake Iroquois Association. https://www.lakeiroquois.org/enjoying/ice-out-date
Lake Rescue Association. (2020). Ice Out. Lake Rescure Association. https://lakerescue.org/ice-out
Lawrimore, J. H., Ray, R., Applequist, S., Korzeniewski, B., & Menne, M. J. (2016). Global Summary of the Month (GSOM) Version 1. NOAA National Centers for Environmental Information. https://doi.org/10.7289/V5QV3JJ
Lombard, P. J., Barclay, J. R., & McCarthy, D.-A. E. (2021). 2020 Drought in New England (ver. 1.1, February 2021). U.S. Geologic Survey. https://pubs.er.usgs.gov/publication/ofr2020114
Mann, H. B. (1945). Nonparametric Tests Against Trend. Econometrica, 13(3), 245. https://doi.org/10.2307/190718
National Centers for Environmental Information. (2021). U.S. Climate Normals. https://www.ncei.noaa.gov/products/us-climate-normal
Preliminary Hurricane/Tropical Storm Irene Weather Summary for the North Country. (n.d.). National Weather Service Forecast Office, Burlington, VT. Retrieved March 12, 2021, from https://www.weather.gov/media/btv/events/Irene2011/Irene2011.pd
President signs disaster declaration for Halloween storm. (2020, January 17). Vermontbiz. https://vermontbiz.com/news/2020/january/17/president-signs-disaster-declaration-halloween-stor
Reidmiller, D.R., Avery, C.W., Easterling, D.R., Kunkel, K.E., Lewis, K.L.M., Maycock, T.K., Stewart, B.C., 2018. Impacts, Risks, and Adaptation in the United States: The Fourth National Climate Assessment, Volume II. U.S. Global Change Research Program. https://doi.org/10.7930/NCA4.201
Runkle, J., Kunkel, K. E., Champion, S., & Dupigny‐Giroux, L. (2017). Vermont State Climate Summary. NOAA Technical Report NESDIS 149-VT. https://statesummaries.ncics.org/chapter/vt/#:~:text=Average%20annual%20precipitation%20has%20increased%20nearly%206%20inches%20since%20the%201960s.&text=Below%20average%20annual%20precipitation%20occurred,of%2042.4%20inches%20per%20yea
Svoboda, M., LeComte, D., Hayes, M., Heim, R., Gleason, K., Angel, J., Rippey, B., Tinker, R., Palecki, M., Stooksbury, D., Miskus, D., & Stephens, S. (2002). The drough monitor. Bulletin of the American Meteorological Society, 83(8), 1181–1190. https://doi.org/10.1175/1520-0477-83.8.118
The Widespread Ice Jam Flooding and Wintry Mixed Precipitation Event on January 12-13, 2018. (n.d.). National Weather Service Forecast Office, Burlington, VT. Retrieved March 12, 2021, from https://www.weather.gov/media/btv/events/12-13Jan2018.pd
Top 5 Weather Events of 2011 across the North Country. (n.d.). National Weather Service Forecast Office, Burlington, VT. Retrieved March 12, 2021, from https://www.weather.gov/media/btv/events/Top5_2011.pd
Town of Elmore. (2021). Lake Elmore Iceout Dates. Town of Elmore, Vermont. https://www.elmorevt.org/community/iceou
Town of Fairlee. (2021). Ice Out on Lake Morey. Fairlee, Vermont The Town Under the Cliff. https://www.fairleevt.org/2016/03/ice-out-on-lake-morey-1977-2016
USGCRP (2018). Impacts, Risks, and Adaptation in the United States: Fourth National Climate Assessment, Volume II: [Reidmiller, D.R., C.W. Avery, D.R. Easterling, K.E. Kunkel, K.L.M. Lewis, T.K. Maycock, and B.C. Stewart (eds.)]. U.S. Global Change Research Program, Washington, DC, USA, 1515 pp. doi: 10.7930/NCA4.2018.
xmACIS. (2021, January 24). Applied Climate Information System NOAA Regional Climate Centers. http://xmacis.rcc-acis.org