Energy
Download chapter PDF and figures
Author
Molly Rose Kelly-Gorham
Department of Electrical and Biomedical Engineering, IGERT Trainee, Gund Institute for the Environment, University of Vermont, Burlington, VT 05401
Citation
Kelly-Gorham, M., 2021. Energy. In Galford, G.L., Faulkner, J. et al. (Eds), The Vermont Climate Assessment 2021. Burlington, Vermont: Gund Institute for Environment at the University of Vermont. DOI: 10.18125/kowgvg.
Table of Contents
- 6.1 Key Messages
- 6.2 Background/Overview
- 6.3 Energy Use in Vermont
- 6.4 Energy Planning and Equity
- 6.5 Impacts of Climate Change on Energy Infrastructure and Solutions
- 6.6 Traceable Accounts
- 6.7 Acknowledgements
- 6.8 References
6.1 Key Messages
- Vermont drivers have the highest average miles traveled per capita in the Northeast United States. Transportation is the largest source of greenhouse gas emissions in Vermont. Thermal energy use is a close second to the largest source of greenhouse gas emissions in Vermont, and the largest use of energy. Reducing energy use in these sectors by choosing more efficient vehicles, selecting heat sources with less emissions, and weatherizing homes will help Vermont meet its energy goals.
- The electricity in Vermont has the lowest carbon intensity in the country. Electrifying transportation and thermal energy use will significantly reduce Vermont’s carbon footprint.
- In the short term, there is extra power line capacity to serve significantly more load in Vermont; however, some areas of Vermont have limited capacity to support further renewable energy generation. Areas where there is limited generation hosting capacity could be prioritized to shift local energy use to electricity to reduce congestion on local transmission lines. The priority in areas with extra generation hosting capacity can be two-fold: building new renewable generation and electrifying local energy use.
- The storms that cause the most frequent power outages are expected to become more intense in the future, increasing the frequency of power outages, particularly in winter. Vermont can increase its energy resilience with distributed solar and storage, secondary heating systems (e.g., wood), and community buildings with resilient heating solutions.
6.2 Background/Overview
Climate change and energy use are interdependent. The release of greenhouse gases (GHGs) into the atmosphere from the use of fossil fuels drives climate change (see Climate Change in Vermont chapter), and conversely the changing climate heavily impacts energy infrastructure by increasing storm intensities and weather variability. Changing climate patterns—such as the warming arctic leading to lower wind speeds and increasing temperatures—decrease wind and solar production efficiency (Solaun and Cerdá, 2019), decrease the capacity of electric power lines, and increase the need for cooling in thermal power plants. More frequent periods of drought induced by climate change can impact water supplies available for hydro generation and thermal generator cooling needs (Zhou et al., 2020). Climate change also impacts energy use in varying ways, increasing the cooling needs in the summer, while creating large variability in winter heating, making needs harder to predict beyond short-term temperature estimates.
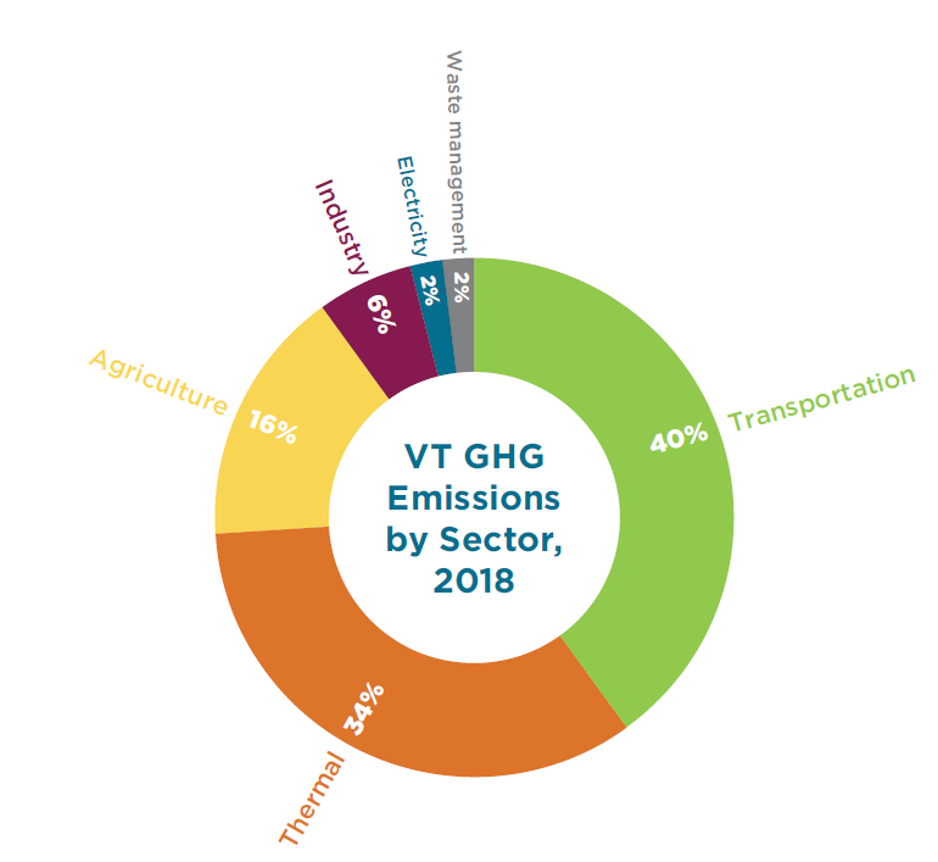
Historical decisions made within the energy sector have had a negative impact on the environment and human health. Now, balancing the immediate needs of communities (thermal, transportation, etc.) with the need to address climate change is a challenge faced across sectors. As shown in Figure 6-1, energy use (which includes thermal, transportation, and electricity) was responsible for 76% of Vermont’s GHG emissions in 2018. Those emissions are not yet decreasing at the rate needed to reach Vermont’s climate goals. Increases in the use of low/no greenhouse emission energy sources for transportation and thermal energy uses and improvements in the efficiency of transportation and thermal energy uses have the best potential to greatly reduce greenhouse gas emissions in the state.
One way to reduce total emissions is to look across sectors for wasted energy, so that wasted energy in one sector that can be captured for use in different sectors. Consider, for example, Vermont’s “cow power” program, which reduces methane production from manure by capturing it and burning it as a biofuel to produce electricity (Levine 2013). While CO2 is produced when methane is burned, methane has about eight times the global warming potential of CO2; additionally, GHG emissions are offset by producing usable energy that would otherwise have been generated another way. This program reduces net GHG emissions by using emissions from the agriculture sector for use in the electricity or thermal sectors.
It should be noted that there are many ways to look at energy use, and they each have nuances about what they include. The data in Figure 6-1 show the impact of energy used within the state, but the figure does not show energy inputs and exports. Thus, the energy used to produce and transport items that are produced elsewhere but consumed in Vermont is not included here. This missing carbon is often called embedded or imported carbon. While it is difficult to say who is responsible for these emissions, it is important to account for them and to minimize them. Since climate change is a global challenge, exporting carbon emissions to other places does not solve the problem.
The Energy Action Network produces an annual progress report that analyzes energy data for the state of Vermont and models pathways to the state’s energy goals. This chapter draws data from this most recent report (Duval et al., 2021) to describe the state of energy within Vermont. This chapter also provides background information about how energy systems work, describes the inherent difficulties of estimating GHG emissions, and suggests data that could be helpful in providing a clearer picture of GHG emissions and energy use in Vermont.
The remainder of the chapter is laid out as follows. Section 6.3 describes energy uses in Vermont, followed by a high-level overview of the energy planning process and equity of energy use in section 6.4. Finally, section 6.5 describes how expected climate change impacts are likely to affect energy infrastructure and offers potential pathways toward resilient energy systems.
6.3 Energy Use in Vermont
Delivering the energy whenever someone decides to turn on a lightbulb, fill a car’s gas tank or battery, and turn up the heat takes enormous preparation, large networks of interdependent infrastructure, and constant monitoring. The energy in each of these examples is considered site energy, as opposed to primary or source energy. Primary or source energy includes energy losses during the transportation and conversion (as is the case with electricity) of the energy. This section gives an overview of the use of energy within Vermont, covering the primary sources of energy, the flow and conversion of that energy into usable forms, and the end uses of energy.
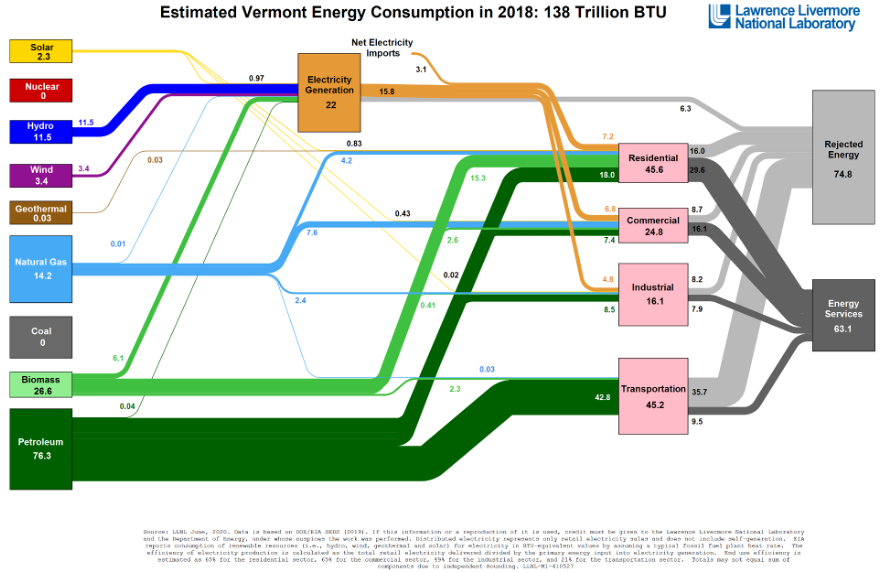
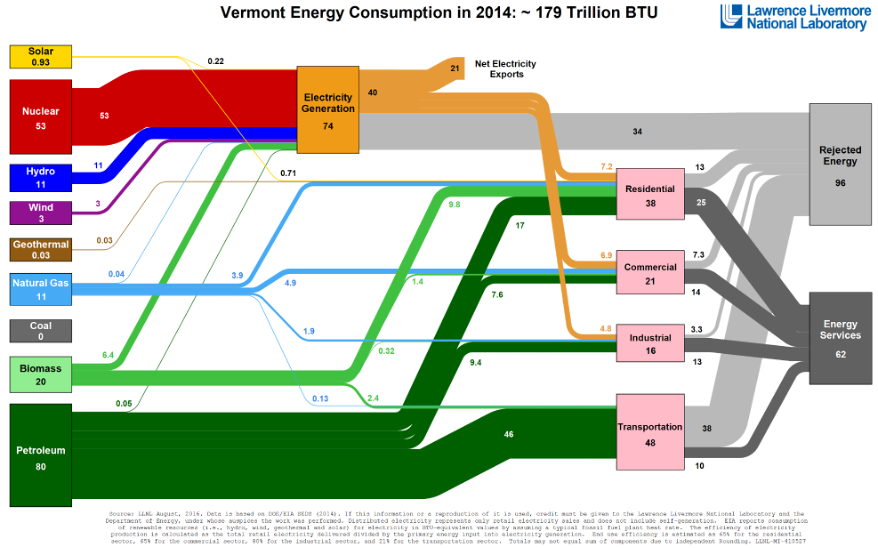
Figure 6-2 shows the flow chart for Vermont’s energy use in 2014 (top) and 2018 (bottom), capturing the whole system from the sources of energy to the end uses. In light gray is the rejected energy, which is energy available in the resource (included in the source energy) but not captured in the conversion to usable energy. The dark grey bands depict energy services, which include all the energy that was used for the intended purpose, be that heating a home, powering lights, or accelerating a car. The estimated rejected energy— energy available in the resource but not captured into usable energy—is accounted for. The conversion into electricity and the flow from the source to different users is shown through the charts’ many connections. It is worth noting that accounting for energy use in Vermont is inexact, since it is difficult to accurately model the primary energy sources of electricity that are imported and the GHG emissions associated with manufacturing, transportation of products sold within the state, and other embedded and imported emissions (Davis & Caldeira, 2010).
6.3.1 Primary Energy Sources
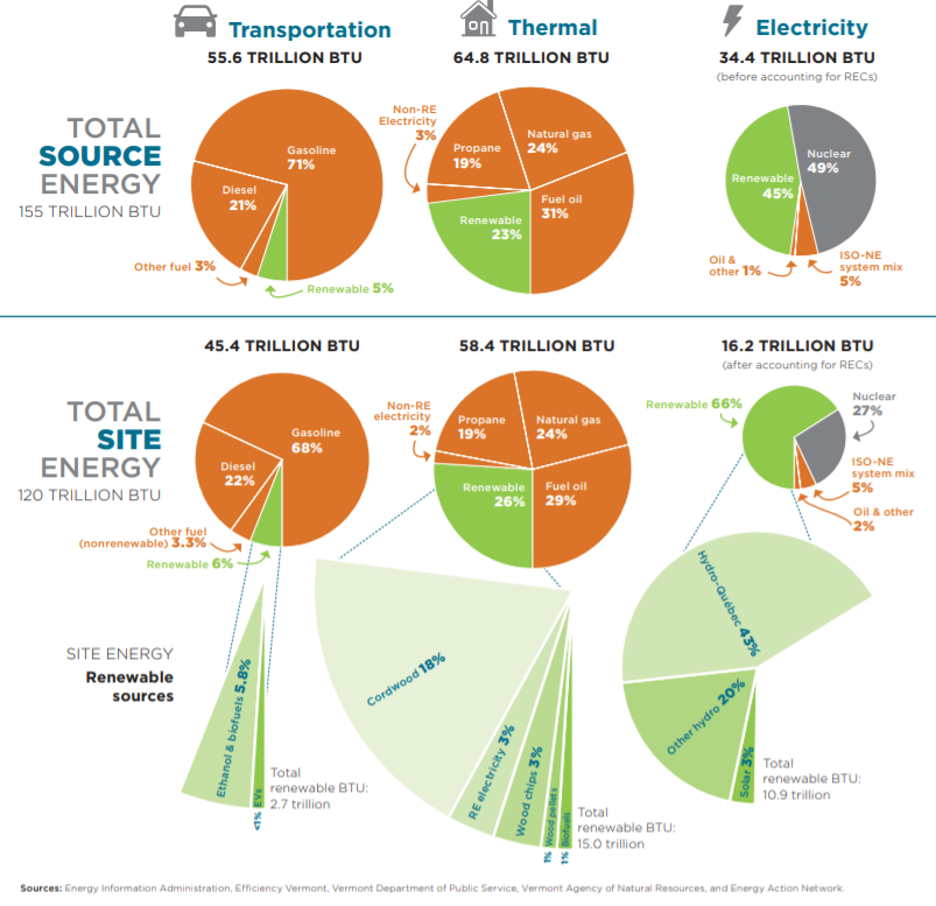
Primary energy sources include not only energy that is used in the state of Vermont, but also the energy that is lost in the process of mining, transporting, converting, and using that energy. Sometimes called source energy, primary energy sources come straight from mines, fracking wells, dams, solar radiance, etc. The source energy attributed to Vermont in 2014 and 2018 is displayed in Figure 6-3.
The sources of energy that were used in Vermont in 2014 include solar, nuclear, hydro, wind, geothermal, natural gas, biomass, and petroleum. In 2014 Vermont Yankee was closed for good, and the difference between the top and bottom images in Figure 6-2 illustrates the large effect of the closure in the reduction in wasted energy, labeled rejected energy in the flow chart, and the switch from 21 BTU equivalent electricity exports to 3.1 BTU equivalent electricity imports.
Vermont’s sources of energy in 2018 included solar, hydro, wind, geothermal, natural gas, biomass, and petroleum, in addition to energy sources imported from other states and Canada to serve Vermont’s electric load. The Water Resources chapter of this report discusses changes in water usage from the shutdown of Vermont Yankee. Many state policies have interacted to lead to the transition seen in the energy generation in the state, this is discussed further later in this chapter.
Not only does the state import electricity, but most of the energy that is used within the state is imported. Source energy can be broken down into sectors, as shown in the top row of the chart in Figure 6-3. Transportation and heating account for most of the energy use in the state and the lion’s share of the nonrenewable energy use in the state. Also shown in Figure 6-3 is the site energy—e.g., the gas pumped into a car or the electricity used by an electric kettle to boil water—which still includes some of the rejected energy shown in Figure 6-2. There is a significant amount of waste heat produced by internal combustion engine vehicles, and even an electric kettle wastes some electricity into waste heat. However, to become categorized as site energy, the primary source energy must first arrive in the expected form on site.
6.3.2 Energy Flow and Conversion
Whether energy comes from a mine, a dam, or a wind/solar farm, it must be both converted and transported, sometimes multiple times, in order to arrive in a useful form at its end-use location. The process of transporting energy can occur before or after converting. Petroleum products must go through a facility to separate the components; natural gas is often transported through pipelines. Various energy sources are converted into electricity and transported in that form through the transmission network. Vermont’s electric network is a small part of the Eastern interconnect, which covers the continental U.S. east of the Mississippi River. There are losses during the transportation and conversion of energy, and there are limitations on the capacity of pipelines to store and transfer petroleum or natural gas and of electric grid wires to provide power.
Vermont is unique in that almost all its energy flows from sources outside the state. There are no fossil fuel mines in the state, so all petroleum products—i.e., gasoline, fuel oil, and natural gas—used within the state are imported. The infrastructure in the state is shown in Figure 6-4. In 2014, the state was exporting electricity to other states for 73% of the hours in the year, but in 2015, Vermont was importing electricity for 84% of the hours in the year (VELCO, 2021). In other words, the state switched from exporting power during the majority of the year to importing power during the majority of the year. The wood harvested for thermal energy each year is about 50% of the new growth in the state (Burlington Electric Department 2019).
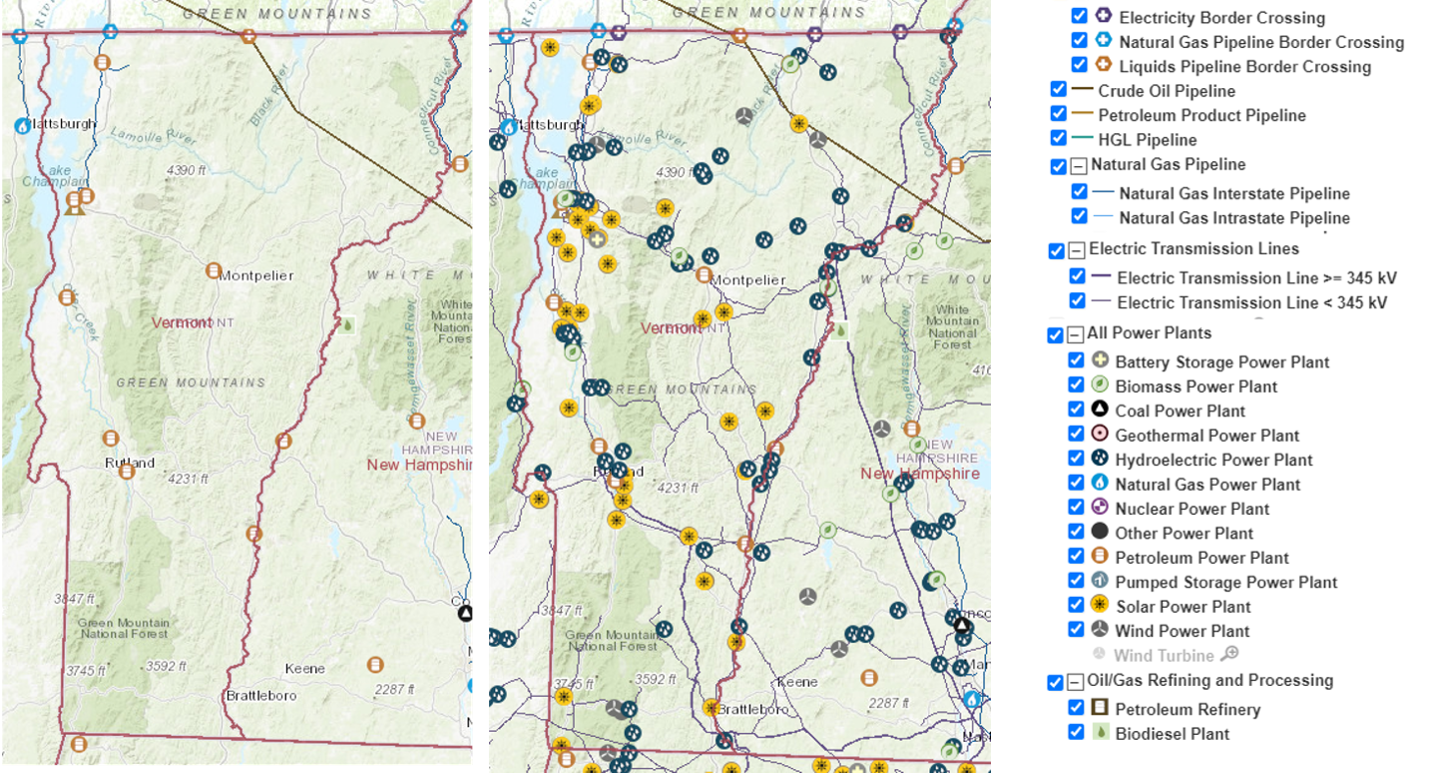
Note: The left panel shows the natural gas and petroleum pipelines coming into Vermont and natural gas and petroleum generators, the middle panel shows the pipelines, electric grid, all generators, and refineries in the state and surrounding area.
6.3.2.1 Electricity
Standard practice in the energy industry is to design systems so that energy supply is always ready to meet demand. This rule applies for most energy supply systems, but it is especially relevant to electric power, where the stability of the network is dependent on supply always matching the combination of demand and the losses. This is key to understanding the challenges needed to overcome to increasingly variable resources. In addition, the push towards using variable resource technologies like wind and solar to supply electric power is occurring within the context of increasing constraints associated with transmitting power into (and not out of) rural areas. The power grid was designed to serve dispersed demand from a few central power plants.
Currently, electricity is still mainly produced from converting forms of stored energy when needed. The exception is variable resource generators (e.g., wind and solar), which are only capable of converting the energy into electricity while that resource is available, i.e., the wind is blowing where wind generators are located, the sun is shining on solar panels, and the water is flowing in rivers with run-of-river hydro generation. The forms of stored energy used to generate electricity when there is electric demand include hydro (with large dams), biomass, natural gas, and petroleum. There are losses in the transmission of electricity from the generators to the end users. However, those losses are small compared with conversion losses that result in waste heat. If not considering embedded emissions, Vermont’s electricity is currently responsible for the lowest GHG emissions of any United States state’s electricity profile (Duval et al., 2021). It is worth noting that any GHG emissions that occurred from energy sources designated renewable are not considered.
6.3.2.2 Natural Gas
Vermont Gas is the only natural gas supplier in the state. It imports gas from Canada to Chittenden, Franklin, and Addison counties. Natural gas is supplied through underground pipelines to personal residences and businesses. Natural gas mainly supports the thermal sector. Energy from natural gas that has been converted into electricity (outside the state) is imported with the regional electric grid system mix and used to supply the state’s electricity demand. The impact of using natural gas to heat depends on the efficiency of the heater and the weatherization of the building.
6.3.2.3 Other Transported Energy
Wood, oil, propane, gasoline, diesel, and biofuels are all transported by pipelines, cargo ships, trains, and vehicles to homes and businesses before being converted from chemically stored energy into usable and waste heat energy used for our thermal, transportation, and electricity needs. Vermont only has one petroleum pipeline coming through the northeast corner of the state (Figure 6-4), so our fuel comes from ports on Lake Champlain, cargo trains, and trucks into the state.
6.3.3 End Uses and Impacts
As seen in Figure 6-3, thermal uses the most energy in Vermont, followed closely by transportation. However, transportation is responsible for 40% of the state’s GHG emissions, while thermal is responsible for 34% of the emissions. There is potential for large increases in the efficiency of energy use for thermal and transportation needs, and yet GHG emissions from these sectors are not decreasing. One example of why this may be the case is the size of vehicles used in the state: despite improvements in vehicle efficiency technologies, the average efficiency of Vermont’s vehicle fleet is largely unchanged (VT Agency of Natural Resources, 2021). A second priority of the state continues to be home and building weatherization, which the state incentivizes. There is potential for scaling these incentives to increase the rate of improving thermal energy efficiency. Boosts in energy efficiency, in general, reduce the amount of energy needed to fulfill the energy needs of Vermont’s population. Electric cars are far more efficient than the gas equivalents, and home weatherization and transitions to more efficient heating options are both ways to decrease the energy use for thermal needs.
6.3.3.1 Transportation
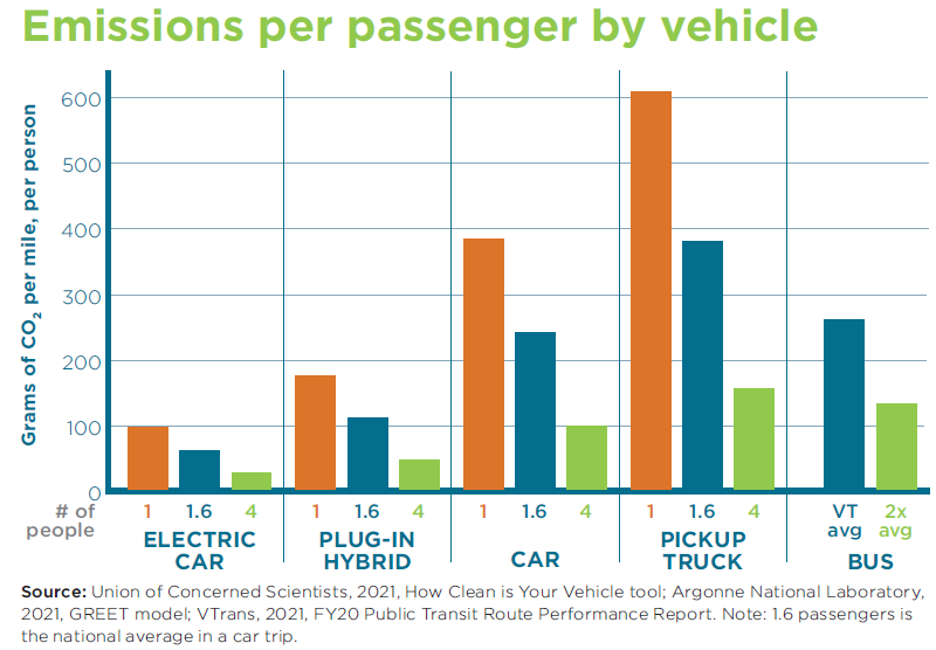
Transportation is the largest producer of GHG emissions in Vermont, producing about 40% of the state’s emissions. It’s also the second largest use of energy, after thermal. Vermonter’s travel on average 11,773 miles each year, which is higher than the average in surrounding states and the United States as a whole (Duval et al., 2021). Shown below in Figure 6-5, is the CO2 production per mile by various vehicle types considering the number of passengers. As public transportation shifts to using electric vehicles, the “bus” column will show far fewer emissions. Manufacturing a mid-sized internal combustion engine car produces approximately 5.6 tCO2e, and a similarly sized electric vehicle produces 8.8 tCO2e (Low Carbon Vehicle Partnership, 2021). The average lifecycle of a car in Vermont is around ten years (WJXT News 4 JAX, 2019). Together, these figures show that the annual CO2 emissions produced by an electric vehicle (2.2 tCO2e) were less than half of the emissions produced by an internal combustion car produces (5.5 tCO2e). Even considering production and the first year of driving, the electric vehicle produces 10.1 tCO2e, while the internal combustion car produces 10.5 tCO2e. The incentives to switch to electric vehicles are making it financially competitive when considering the lower cost of fuel. In addition, the emissions from operating electric cars are lower to operate the electric vehicle, so much so that the additional emissions that go into producing electric vehicles are offset within the first year. Behavior changes—driving less, telecommuting, carpooling, utilizing public transit, and community restructuring to support greater walkability—are also important ways to reduce the impact of transportation on the state’s GHG emissions.
6.3.3.2 Heating
Energy used for heating is the largest use of energy in the state of Vermont. The two most common heat sources in the state are fuel oil and natural gas, as shown in Figure 6-3. Weatherizing houses is extremely important to making comfortable homes that can be heated efficiently, especially considering the state’s housing stock is some of the oldest in the country. The commercial sector uses even fewer renewable sources than the generalized state heating sources (Duval et al. 2021). Table 6-1 shows the fuel used both as the primary and supplemental forms of heating in Vermont for 2018-2019. The estimated number of households using each fuel source comes from surveys performed by the Vermont Department of Forests, Parks, and Recreation and the University of New Hampshire Survey Center (VT Department of Forests, Parks and Recreation, 2019). Note that the sum of the final column is more than 100% because it represents the percent of the state using both primary or secondary heat sources, and so many households are counted twice.
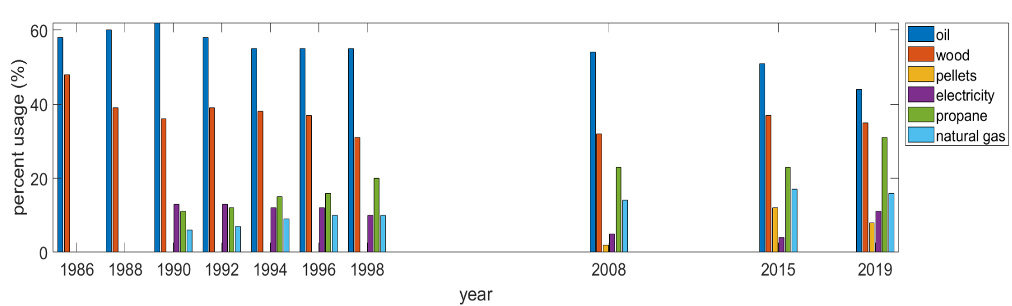
Figure 6-6 shows which fuel used for heating in Vermont in the years in which data was collected between 1986 and 2019. Oil and wood remain the most prevalent fuels, although the fuels used for heating have diversified in approximately the last decade. Table 6-1 and Figure 6-6 show that residential heating sources and commercial and industrial heating sources continue to rely heavily on fossil fuels (Duval et al., 2021).
| Fuel | Estimated Primary Households | Percent of State | Estimated Supplemental Households | Percent of State | Total Households | Percent of State |
|---|---|---|---|---|---|---|
| Oil | 88,704 | 34.3% | 24,723 | 9.6% | 113,427 | 43.9% |
| Bioheat | 669 | 0.3% | 0 | 0.0% | 669 | 0.3% |
| Cordwood | 56,753 | 22.0% | 33,655 | 13.0% | 90,408 | 35.0% |
| Electricity | 8,178 | 3.2 | 21,059 | 8.1% | 29,237 | 11.3% |
| Propane | 43,630 | 16.9% | 35,065 | 13.6% | 78,695 | 30.4% |
| Natural Gas | 37,245 | 14.4% | 4,569 | 1.8% | 41,814 | 16.2% |
| Kerosene | 7,066 | 2.7% | 3,128 | 1.2% | 10,194 | 3.9% |
| Coal | 529 | 0.2% | 402 | 0.2% | 931 | 0.4% |
| Wood Pellets | 10,906 | 4.2% | 10,542 | 4.1% | 21,448 | 8.3% |
| Solar | 369 | 0.1% | 2,209 | 0.9% | 2,578 | 1.0% |
| Other | 2,670 | 1.0% | 6,911 | 2.7% | 9,582 | 3.7% |
| Don’t Know | 1,815 | 0.7% | 0 | 0.0% | 1,815 | 0.7% |
| Total | 258,535 | 100% | 142,263 | 55.03% |
6.3.3.3 Electricity
Vermont’s electricity is the cleanest in the country, based on estimates that it contributes 2% of the state’s GHG emissions. Electricity supplies 13.8% of the site energy and 22.1% of the source energy to the state (Duval et al., 2021). There is no carbon accounting for hydropower, solar, and wind, although this does include the estimated contribution from the imported electricity attributed to fossil fuel sources. There are carbon emissions from the flooding process involved in creating the dams used in hydropower, and Hydro-Québec does produce carbon from this process (VT Agency of Natural Resources, 2021). Whether Canada should be quantifying the GHGs produced by Hydro-Québec on a land use basis or an electricity production basis is being debated (Gokee, 2020). There are also carbon emissions associated with the manufacturing, transportation, and installation of solar and wind resources. Life-cycle assessments on renewable resources for potential generation sites are needed to optimize both where resources are placed and what type of generation resources will lead to minimum net greenhouse gas emissions. Including diverse information on the potential impacts is also important in siting renewable resources to ensure that other important ecosystem services, such as diversity and water storage, are not accidentally compromised.
6.4 Energy Planning and Equity
Energy policy can protect vulnerable communities and impact energy sources Energy policy can protect vulnerable communities and impact energy sources and energy use in Vermont. For example, Vermont’s electricity sources are estimated to have the lowest GHG emissions of any state in the United States (Duval et al., 2021), and the biggest changes in emissions from the electricity sector occurred after policies strongly incentivized the development of renewable energy.
6.4.1 State Level Energy Planning
There are many players and actors in energy planning. In the electricity sector, actors include the independent system operator for New England, ISO-NE; the transmission operators and planners in Vermont, VELCO: the Vermont Department of Public Service; and the Vermont Public Utility Commission (PUC). Further, actions need to be approved at either the federal or state level, depending on the type of action. At the federal level, the Federal Energy Reliability Council makes the rulebook for interstate wholesale power sales. At the regional level, ISO-NE must approve transmission planning. At the state level, the Vermont PUC must approve retail rate changes, siting new resources, and renewable planning (Vermont Business Magazine, 2021; VT Department of Public Service, 2021).
In large part due to the work of Efficiency Vermont, electric energy consumption in Vermont is relatively stagnant, even decreasing slightly from 2014 to 2018, as shown in the charts in Figure 6-2. Vermont’s electricity sector has shown capacity to react to new policies. Several state policies—including the Sustainably Priced Energy for Economic Development (SPEED) program, net metering, standard offer, and the renewable energy standard—have helped the electricity sector transition to a more renewable energy portfolio (VT Department of Public Service, 2021). Since new transmission and distribution (T&D) investments are expensive and time-consuming projects that impact local landscapes, stakeholders in Vermont minimize the amount of new T&D construction. The slow increase of electric rates in Vermont can be seen in these decisions as well, because T&D investments can result in large increases to customer electric rates. Yet, enabling a rapid transition to renewable energy will require that new renewable energy projects be rapidly approved and connected to the grid where the power is needed. There are many challenges in that process, including land use disputes, choosing plant locations that aren’t sequestering carbon, placing energy resources in an equitable way, and placing and sizing resources where the grid has capacity for the power.
6.4.1.1 Global Warming Solutions Act
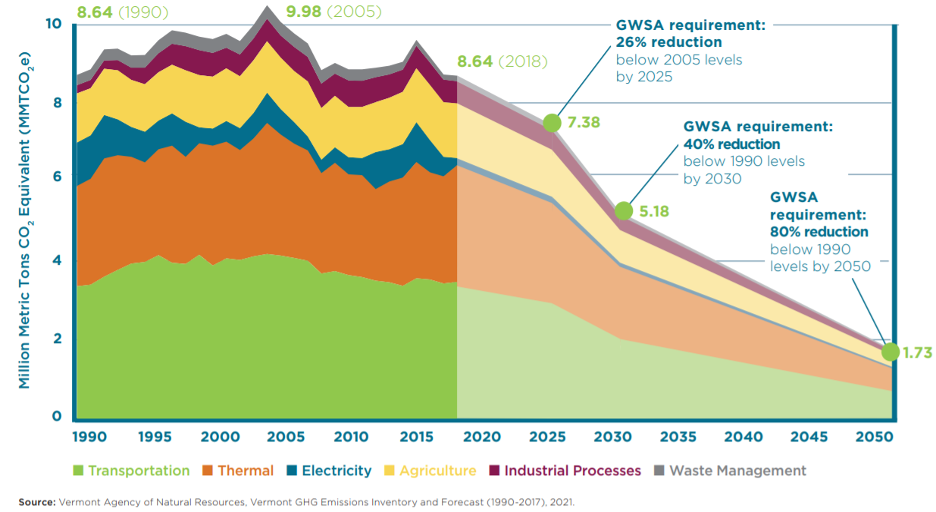
The Global Warming Solutions Act (GWSA) is a state bill that adds enforceable targets to Vermont’s goal of reducing carbon emissions. The bill also requires that the pathways utilized to get to the required emission reductions reduce energy burden. Energy burden is related to the amount of money a person spends on energy resources compared with their income; a high energy burden would occur if a large percent of a household’s income goes towards the energy use of the household. Figure 6-7 shows carbon emissions by sector and a potential pathway to meet each of the required GHG reduction benchmarks in the act. This policy makes the state accountable for achieving these goals. The figure shows how transportation, thermal energy, electricity, agriculture, industrial processes, and waste management have contributed to the GHG emissions of the state over time and how they must reduce emissions to reach GWSA targets. It is clear how the electricity sector has reduced emissions, with support from the state’s policies. Similar reductions have not been seen in transportation or thermal energy use.
Since transportation is the leading producer of GHG emissions in the state, shifting the use of fossil fuels to electricity produced with the current mix of generation types will significantly decrease GHG production from the transportation sector and the state. Weatherizing to increase buildings’ thermal efficiency and electrifying home and building heat sources are other large components of the emissions reductions pathways required by the GWSA and shown in Figure 6-7.
6.4.1.2 Electricity Demand Forecasts
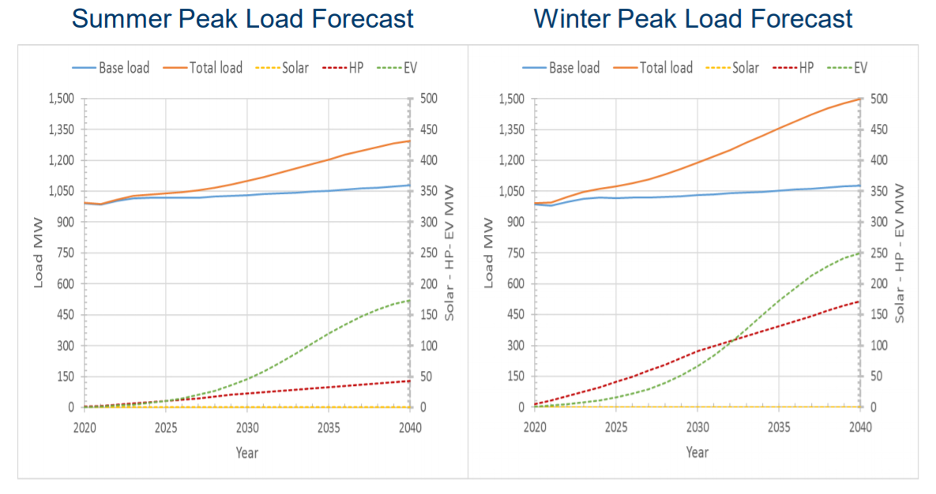
Plans to electrify energy use of the thermal and transportation sectors could significantly increase electricity use in the state. Since electric grids have been planned around certain levels of electricity use, it is especially important to plan for a potentially sudden increase in electricity use in the state. Figure 6-8 shows the summer and winter peak forecasts from VELCO’s long-range transmission plan. These forecasts are based on a scenario where peaks are expected to be higher than 90% of the possible load scenarios under extreme weather conditions (VELCO, 2021). As shown in the figure, the largest increase in demand over the next twenty years is expected to be the charging of electric vehicles and the use of heat pumps. A huge part of the pathway to the state’s commitment to reduce GHG emissions will be achieved through this increase in electricity use and decrease in fossil fuel consumption. Another recent development contributing to electrification is the designation of three of Vermont’s highways as alternative fuel corridors. This illustrates the state’s commitment to transitioning the vehicle fleet to electric vehicles (Vermont Business Magazine, 2021). Roadways designated as “corridor ready” will offer sufficient access to charging stations to support electric vehicle travel. This promotion of the Vermont highway system may further increase electric load, as tourists with electric vehicles may prioritize these routes for travel between cities in Vermont and outside, such as, Boston, Albany, and Montreal.
6.4.1.3 Land Use Changes
Land use is a complex issue that has implications beyond each parcel of land. Some land provides services outside its boundaries, such as clean water from the mountains, local food grown on and harvested from farms, and beautiful outdoor spaces and carbon sequestration from forests. Depending on the management of land and changes in the uses of land, these services can be compromised or developed. For example, as a forest shifts to developed land, many ecosystem services are compromised. Or as a capped landfill changes its land use to electricity production with the installation of solar energy resources, an energy service of that land is developed. Increasing renewable energy generation in the state will result in significant land use change across the state. However, with the state’s low population density, currently less than 1% of the state’s land use would need to change to supply the state’s electricity usage with renewable generators (Thomas and Racherla, 2020). Of course, that is not to say there won’t be disputes over land use in the transition to renewable energy (Davis, 2015). Careful planning will be required to ensure an equitable and efficient placement of resources.
Converting land can be controversial, and there are carbon sequestration benefits for some land that could be lost if converted to electricity production, for example, when removing a forest to put in solar panels involves lost carbon sequestration from the trees. Chinnery (2021) estimates that this scenario may lead to the emission of 11.6 tCO2e; however, Chinnery (2021) also calculates that that panel is expected to produce emission-free electricity for many years, offsetting GHG emissions from where that electricity would be produced otherwise. The same study found that the GHG emissions cost of cutting down one tree and installing a solar panel are about an order of magnitude less (10 times less) than the expected emissions offset by the electricity produced by the panel (Chinnery, 2021). On one hand, more than one panel could be installed by removing the shade from a whole tree, creating a more favorable case for installing the energy resource. On the other hand, with the state’s relatively low carbon electricity profile, the case in Vermont would likely favor the tree more than the estimation calculated in Chinnery (2021). It is also important to remember the current land use and the cost of changing land use in siting decisions. For example, building roads where there were none to install energy resources comes with a cost of carbon emissions. While cutting down a forest and installing solar panels leads to fewer carbon emissions per KW than running a coal plant, that comparison is only applicable when the electricity produced by the array of solar panels offsets electricity produced by a coal plant (Turney and Fthenakis, 2011). Forests provide many ecosystem services, not only carbon sequestration, and they are a huge part of Vermont’s identity (as is discussed in far more detail in the Climate Change in Forests chapter). Thus, prioritizing non-forested land for renewable electricity generation placement is preferred. To ease some of the anticipated pains related to the transition to renewable energy, there is potential to combine uses to best serve the communities needs where infrastructure is added. For example, combining pollinator habitat with solar and combining sheep grazing with solar are both being practiced with good success in the state.
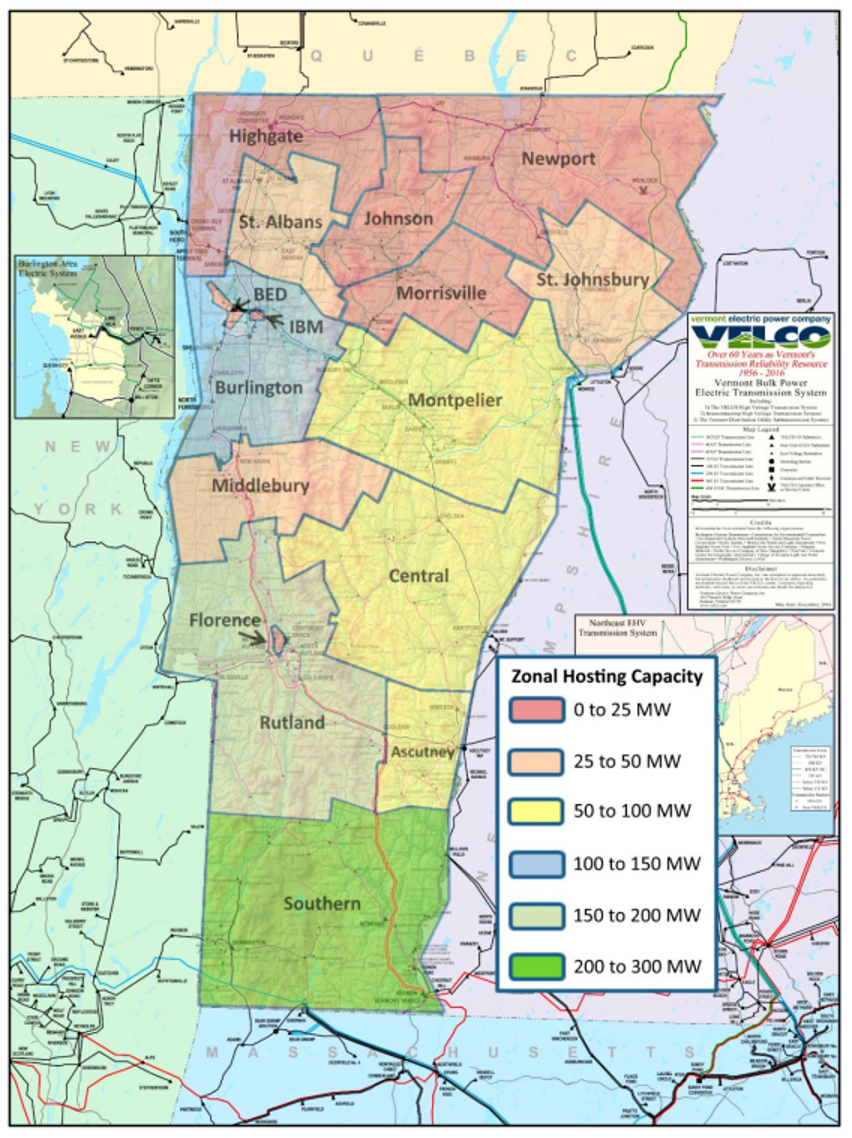
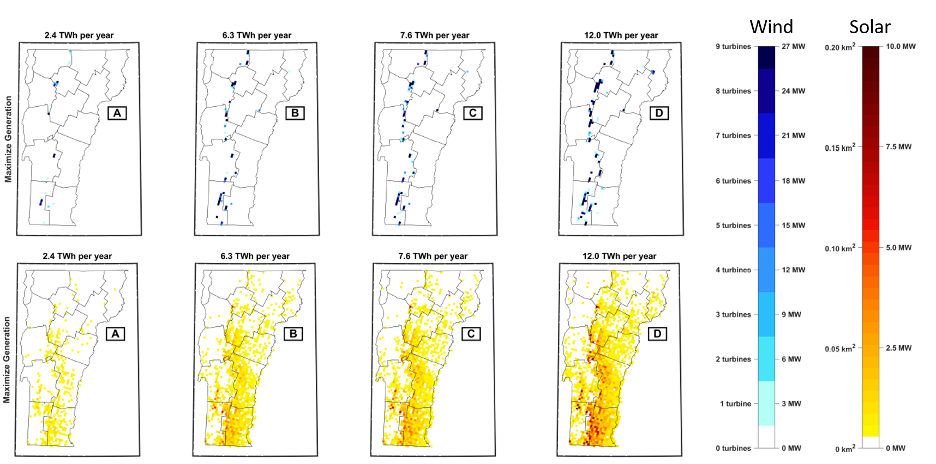
Several factors are important to consider when siting new wind and solar generation, including energy production per unit land, land cost, land use change, and T&D capacity. The electric grid in Vermont has very limited capacity to support larger power flows out of certain areas in the state (McCallum, 2021; VELCO, 2021). As illustrated in Figure 6-9, this is especially true along Vermont’s northern border due to high renewable capacity already installed, incoming power from Canada, low capacity to transmit additional power out of the region, and low demand in this area. The potential to maximize energy production over the year is not equal in of all regions of the state. Figure 6-10 shows several estimates from a study on how to meet Vermont’s goals to meet 100% of the electricity demand with renewables in 2050 (Thomas and Racherla, 2020). There is a significant amount of overlap with the best placement of solar for potential energy output, shown in oranges to reds, and the region least constrained to additional distributed generation in southern Vermont. There is also some overlap in further west southern Vermont for the best placement of wind for potential energy output.
6.4.1.4 Northern Vermont
There are many balancing acts to be achieved when planning the future of the grid. Ideally, the grid will be capable of supporting electricity needs at an affordable price with very high reliability using only renewable energy. One example of the balancing act for investing in the grid comes from the Northeast Kingdom in Vermont, where the transmission capacity to import and export electricity is limited, and renewable energy development is already high. Wind generation in northern Vermont is curtailed 13% of the time (Root, 2016), mostly due to reliability concerns from ISO-NE, which calls for the wind generators to shut down in order to maintain grid stability in the event of a line loss (an electric transmission line going down). New transmission lines are extremely expensive and would need to be approved by the PUC and ISO-NE, and the costs will, eventually, be passed to consumers.
There are a couple of options for adding more renewable energy in the area and/or reducing curtailment of the resources that already exist there. One option is to invest in higher capacity T&D, and the other is to focus on transitioning as much energy use in the region as possible to electricity and using demand-side management to time the use of energy with the production from renewables. Incentivizing resources like high performance computers or data centers, which use a lot of electricity, to the region and other areas where there is a lack of additional distributed generation capacity can help to utilize locally generated energy that would otherwise be curtailed because of the constraints of the transmission network. Mobile batteries (such as the Nomad units being developed in Vermont; see https://www.nomadpower.com/) used in the Northeast Kingdom to absorb energy from renewable sources and transport it to demand centers like Burlington could help with short-term transitions as investments in the grid are being planned.
6.4.1.5 Sub-State Plans
Vermont Act 174, passed in 2016, requires every county in Vermont to formulate individual energy plans to meet the statewide comprehensive energy plan (CEP). These plans are available from the Vermont Department of Public Service (VT Department of Public Service, 2021). The plans enumerate several strategies on the path towards the state’s CEP goal to be 90% renewable by 2050. Bennington County has several energy goals outlined in its report, including, to “assure diversity in the mix of energy sources to minimize the impacts of a supply restriction in any particular fuel” and to increase the local generation of energy to expand energy options to the population there. The county also expected further population decline (Bennington County Regional Commission, 2017). The northwest regional planning commission’s energy plan brings to light the relationships between counties by looking at residents’ reliance on employment in Chittenden County and examining the potential to benefit the county and state by supporting renewable energy generation to supply Chittenden County’s growing electric load (Northwest Regional Planning Commission, 2017). Chittenden County’s 2018 ECOS plan includes a helpful color map showing where wind and solar has good potential and low constraints (Chittenden County Regional Planning Commission, 2018). One example of advanced sub-state planning can be seen in the city of Burlington, which already produces all its electricity from renewables and is now considering the Net Zero Energy plan, a comprehensive energy approach to reducing the city’s GHG impact (Kallay et al., 2019). A large component of Burlington’s plan is district heating, which has the potential to be more efficient and may save money when compared with the costs of installing new technology in each downtown building.
6.4.2 Energy Equity
Vermonters who have the highest energy burden are, on average, using less energy than those with low energy burden (Duval et al., 2021). Despite the fact that households with the highest energy burden are contributing less to climate change, climate change is likely to have more impact on those households as increasing temperature extremes increase energy consumption (Raimi and Wason, n.d.). When developing new energy policies, inviting a diverse spectrum of people to the table is key to finding solutions that work for voices heard less often. The California PUC, for example, has a program to compensate participation in the decision-making process and recently began requiring that written public comments be specifically addressed in the decision-making process (Spelt, 2020). In Oregon, data is being gathered to better understand how these incentives help and which populations those incentives end up reaching (Rubado, Griguhn, and Novie, 2018). Similar data collection in Vermont could help facilitate the reach of incentives to the population for which making the changes mandated by the GWSA will have the highest burden. Figure 6-11 depicts the percent of heating types within Bennington County by owner and renter households; it shows that renter households are more likely to heat with higher priced heating fuels. Incentive programs have the potential to have greater impact for Vermonters with higher energy burden, such as weatherization; a focus on energy equity will help ensure that Vermont programs offer incentives that can help reduce energy burden.
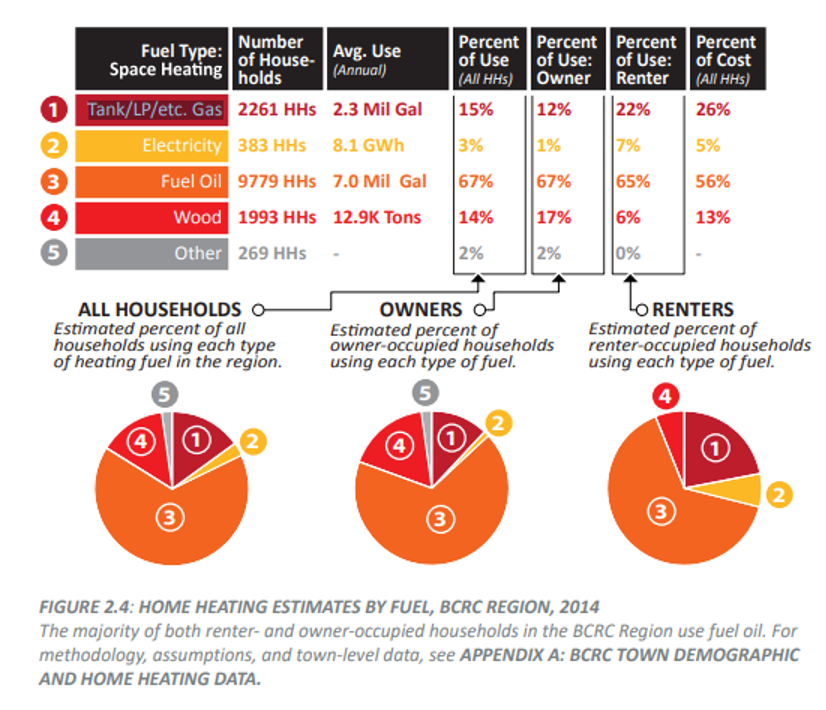
Note: By comparing heat sources where the percent of use is lower than the percent of cost, the figure shows that renters, who have more limited control over the heating option, use a greater percent of the heat sources that come with higher costs.
6.5 Impacts of Climate Change on Energy Infrastructure and Solutions
Not only are the sources of energy we use driving climate change, but climate change is driving how and when we consume energy and increasing the risk of damage to infrastructure from weather events. Increasing temperature will lead to increased air conditioning load in the summer and shoulder seasons. However, as shown in Figure 6-8, the base load is not expected to rise for a few years. Additionally, cold climate heat pumps, which can be used for both heating and cooling, are expected to increase cooling load on the grid. In other words, heat pumps are not expected to replace central cooling systems in most cases; instead, Vermonters will add climate heat pumps to their existing systems (VELCO, 2021). On average, warmer winters will lead to less energy used to heat homes, but the large variability in winter temperatures may mean that Vermonters prepare for the coldest cases. Not only are “normal” weather patterns changing, but the energy in storms also is increasing, which means that more intense storms are expected in the future (VELCO, 2021). These changes are leading to a public and policy focus on resilience of infrastructure, which prioritizes preparation for and mitigation of high impact, low probability events.
Electrifying heating and transportation within the state puts more pressure on the electric grid to be reliable and resilient. The exceptionally cold weather in February, 2021 in Texas illustrate the effects that more extreme weather events can have on infrastructure, and these significant infrastructure failures can result in deaths (Englund, 2021). Hurricane Irene caused widespread damage in Vermont, and damaged millions of dollars of infrastructure (Hewitt, 2016). Large events tend to expose often neglected interdependencies among infrastructure systems. For example, damage to the transportation system can increase the time it takes to repair damaged electricity infrastructure. Conversely, electricity outages can cause traffic lights to go out, grocery store coolers to go down, water treatment plants to malfunction, etc.
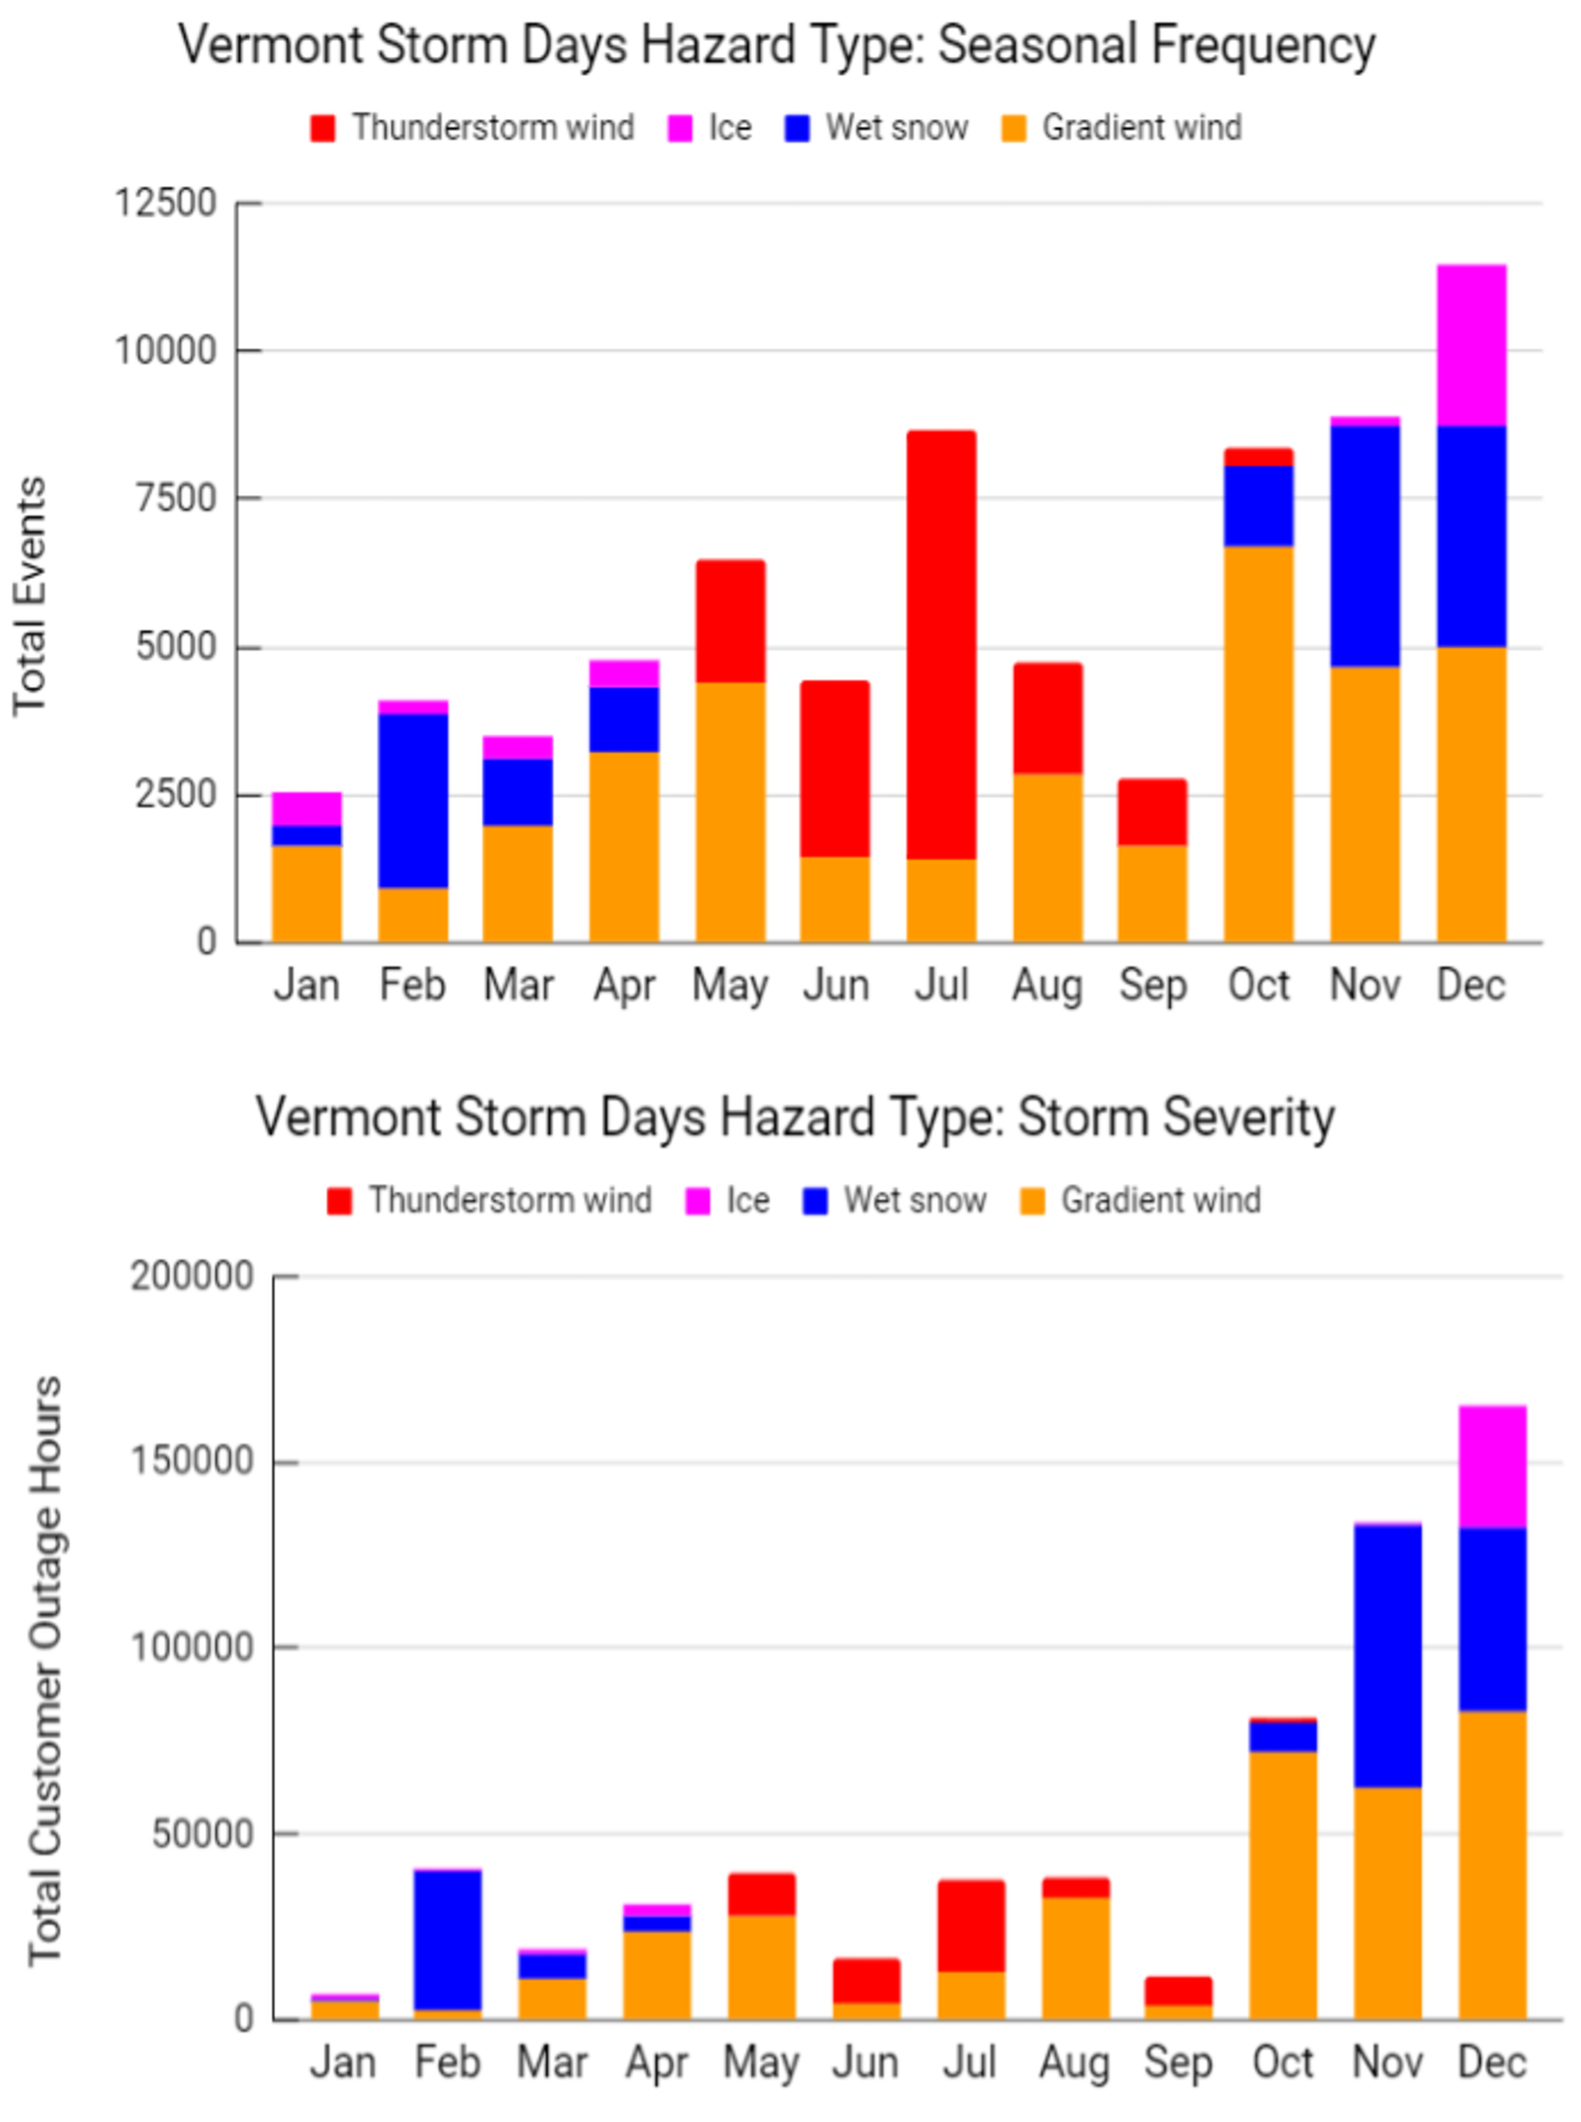
Figure 6-12 (top) shows weather events in Vermont for the past eleven years by month and event type (thunderstorm wind, ice, wet snow, and gradient wind). Weather analysis for future climate scenarios in the draft of the latest long-term transmission plan from VELCO concludes that flooding and high precipitation events are occurring at higher intensities and conditions for more intense storms will continue to be prevalent, especially in the late fall. Figure 6-12 (bottom) shows the cumulative hours in which customers’ electricity went unserved in the Green Mountain Power service zone by event type and month from 2008 to 2019. The clear outlier are the outages occurring in October, November, and December, which by far have the most unserved customer hours. Electricity outages are often caused by tree limbs falling or tree failures during severe weather events, and large trees falling onto electric lines cause long and costly outages (Green Mountain Power, 2019).Thus, an essential part of the resilience strategy for reliable and resilient electricity supply is maintaining rights-of-way with consistent tree trimming.
While not a requirement, ensuring backup systems for heating in Vermont households is suggested. Most heating options will not operate under prolonged electricity outages. The options that do not fail are far more limited, the most common of them are traditional wood stoves. Another option is developing microgrids that combine backup batteries and solar energy to provide a backup option for power outages. While it may not be feasible for every household to have a back-up wood stove for heating and solar plus storage for transportation, a community building with a wood stove and solar plus storage back-up for emergency purposes is a more efficient option that can increase the resilience of the community to extreme weather events (see Community Development chapter). Backup electricity storage, especially when paired with solar, also has the potential to make many systems more resilient to electricity outages. Homes, hospitals, grocery stores, and water treatment plants could use the backup electricity storage. Undergrounding electric lines can prevent some outages from occurring, especially due to wind, ice, and snow; however, underground lines are far more expensive and, if they do need to be repaired, repair times take significantly longer.
6.6 Traceable Accounts
Traceable accounts describe the confidence level—the degree of certainty in the scientific evidence—for each key message resulting from this chapter. This analysis is based on the U.S. Global Change Research Program guidance in the Fourth National Climate Assessment (USGCRP, 2018).
Confidence Level
- Very High – Strong evidence (established theory, multiple sources, confident results, well-documented and accepted methods, etc.), high consensus
- High – Moderate evidence (several courses, some consistency, methods vary, and/or documentation limited, etc.), medium consensus
- Medium – Suggestive evidence (a few sources, limited consistency, models incomplete, methods emerging, etc.), competing schools of thought
- Low – Inconclusive evidence (limited sources, extrapolations, inconsistent findings, poor documentation and/or methods not tested, etc.), disagreement or lack of opinions among experts
Key Message 1
Vermont drivers have the highest average miles traveled per capita in the Northeast, and transportation is the largest source of greenhouse gas emissions in the state. The thermal energy use of the state is the largest use of energy and a close second to the largest source of emissions in Vermont. Reducing energy use in these sectors by choosing more efficient vehicles, heat sources with fewer emissions, and weatherizing homes will help Vermont meet its energy goals.
- Confidence level: Very high
- References: See chapter text
Key Message 2
The electricity in Vermont has the lowest carbon intensity in the country. Electrifying as much transportation and thermal energy use as possible will significantly reduce Vermont’s carbon footprint.
- Confidence level: High
- References: See chapter text
Key Message 3
In the short term there is plenty of extra power line capacity to serve significantly more load in Vermont; however, some areas of Vermont have very limited capacity to support further renewable energy generation. Areas where there is limited generation hosting capacity could be prioritized for shifting local energy use to electricity to reduce congestion on local transmission lines. The priority in areas with extra generation hosting capacity can be two-fold: building new renewable generation and electrifying local energy use.
- Confidence level: Medium
- References: See chapter text
Key Message 4
The storms that cause the most frequent power outages will become more, increasing the frequency of power outages, particularly in winter. Vermont can increase resilience with distributed solar and storage, secondary heating systems (e.g., wood), and community buildings with resilient heating solutions
- Confidence level: Medium
- References: See chapter text
6.7 Acknowledgements
I would like to acknowledge Jay Schafer of Northview Weather for the contribution of his analysis on electricity outages during storm days in Vermont. I would also like to thank Ed McNamara, Jared Duval, and Paul Hines for taking the time to review this chapter, and Gillian Galford and Laura Edling for the opportunity to collaborate on the Vermont Climate Assessment.
6.8 References
Bennington County Regional Commission. (2017). Bennington County Regional Energy Plan. Vermont Department of Public Service. https://publicservice.vermont.gov/sites/dps/files/documents/Pubs_Plans_Reports/Act_174/BCRC/BCRC%20Energy%20Plan.pdf.
Burlington Electric Department. (2019). 2020 Long-Term Electric Energy and Demand Forecast Report. Burlington, VT: Burlington Electric Department / Itron Inc.
Chinnery, L. (2021). “Should You Cut down Trees to Go Solar?” Energy Sage. https://news.energysage.com/should-you-cut-down-trees-to-go-solar/.
Chittenden County Regional Planning Commission. (2018). 2018 Chittenden County ECOS Plan. https://publicservice.vermont.gov/sites/dps/files/documents/Pubs_Plans_Reports/Act_174/CCRPC/ECOSPlan_MainPiece_FinalDraft_20180611.pdf.
Davis, M. (2015). “Irasburg Howls Over Wind Turbine Plan.” Seven Days. https://www.sevendaysvt.com/vermont/irasburg-howls-over-wind-turbine-plan/Content?oid=3053275.
Davis, S.J., and Caldeira, K. (2010). “Consumption-Based Accounting of CO2 Emissions.” Proceedings of the National Academy of Sciences, 107(12): 5687.
Duval, J., Butler, M., Robechek, C., Wesley, C., and Seddon, L. (2021). Annual Progres Report for Vermont 2020/2021. Annual Progress Report. Montpelier, VT: Energy Action Network. https://www.eanvt.org/wp-content/uploads/2021/06/EAN-APR2020-21_finalJune2.pdf.
Englund, W. (2021). “Colonial Shutdown Shows How Americans Pay the Price of Efficiency.” The Washington Post. https://www.washingtonpost.com/business/2021/05/15/energy-cost-cutting-price.
Gokee, A. (2020). “Study: More Reliance on Electricity Can Create Local Jobs, Save Money.” VT Digger. https://vtdigger.org/2020/12/24/study-more-reliance-on-electricity-can-create-local-jobs-save-money/.
Green Mountain Power. (2019). 2018 Integrated Vegetation Management Plan. Green Mountain Power. https://outside.vermont.gov/agency/agriculture/vpac/Other%20VPAC%20Documents/Rights-of-Way-ROWs/2020_Permit_applications/GMP%202020-Distribution/2018%20GMP%20Dist%20Veg%20Mgmt%20Plan%203-18-19.pdf (August 11, 2021).
Hewitt, E. (2016). “Five Years after Irene, Vermont Has Rebuilt, but Marks Remain.” VTDigger. https://vtdigger.org/2016/08/25/five-years-after-irene-vermont-has-rebuilt-but-marks-remain/ (April 27, 2021).
Kallay, J., Hopkins, A., Frost, J., Napolean, A., Takahashi, K., Slason, J., Freeman, J., Grover, D., Swanson, B. (2019). Net Zero Energy Roadmap for the City of Burlington, Vermont. Prepared for the Burlington Electric Department. https://www.burlingtonelectric.com/sites/default/files/inline-files/NetZeroEnergy-Roadmap.pdf.
Levine, S. (2013). “Cow Power, the Vermont Brand Electricity.” Rutland Herald / Times Argus. https://www.clf.org/blog/cow-power-the-vermont-brand-electricity/.
LLNL. (2016). “Vermont Energy Consumption in 2014 Based on DOE/EIA SEDS.” Lawrence Livermore National Library. https://flowcharts.llnl.gov/content/assets/images/charts/Energy/Energy_2014_United-States_VT.png (August 11, 2021).
LLNL. (2020). “Vermont Energy Consumption in 2018 Based on DOE/EIA SEDS.” Lawrence Livermore National Library. https://flowcharts.llnl.gov/content/assets/images/charts/Energy/Energy_2018_United-States_VT.png (August 11, 2021).
Low Carbon Vehicle Partnership. (2021). Lifecycle Emissions from Cars. Low Carbon Vehicle Partnership. https://www.zemo.org.uk/assets/workingdocuments/MC-P-11-15a%20Lifecycle%20emissions%20report.pdf.
McCallum, K. (2021). “Grid Block: Vermont’s Aging Transmission Network Can’t Keep Pace With Green Power Projects.” Seven Days. https://www.sevendaysvt.com/vermont/grid-block-vermonts-aging-transmission-network-cant-keep-pace-with-green-power-projects/Content?oid=32560538.
Northwest Regional Planning Commission. (2017). Regional Energy Plan. https://publicservice.vermont.gov/sites/dps/files/documents/Pubs_Plans_Reports/Act_174/NRPC/NRPC%20Energy%20Plan.pdf.
Raimi, D, and Wason, E. (n.d.) “Defining, Measuring, and Addressing Energy Poverty, with Tony Reames.” https://www.resources.org/resources-radio/defining-measuring-and-addressing-energy-poverty-with-tony-reames/.
Root, C. (2016). “Northern VT Limits and Potential Solutions.” https://opcom.velco.com/library/document/download/5352/VII%20N%20VT%20Limits%20and%20Potential%20Solutions.pdf.
Rubado, D., Griguhn, A., and Novie, A. (2018). 2018 Diversity, Equity and Inclusion Data and Baseline Analysis. Energy Trust of Oregon. https://www.energytrust.org/wp-content/uploads/2018/12/2018_DEI_Data_Baseline_Analysis.pdf.
Schafer, J. (2021). Analysis provided by Northview Weather with support from VELCO.
Solaun, K., and Cerdá, E. (2019). “Climate Change Impacts on Renewable Energy Generation. A Review of Quantitative Projections.” Renewable and Sustainable Energy Reviews 116: 109415.
Spelt, M. (2020). “Democratizing California’s Most Powerful Regulator.” The Equation. https://blog.ucsusa.org/mark-specht/democratizing-californias-most-powerful-regulator/.
Thomas, A., and Racherla, P. (2020). “Constructing Statutory Energy Goal Compliant Wind and Solar PV Infrastructure Pathways.” Renewable Energy, Elsevier 161(C): 1–19.
Turney, D., and Fthenakis, V. (2011). “Environmental Impacts from the Installation and Operation of Large-Scale Solar Power Plants.” Renewable and Sustainable Energy Reviews 15(6): 3261–70.
U.S. Energy Information Administration. (2021). “U.S. Energy Mapping System.” https://www.eia.gov/state/maps.php?src=home-f3 (August 11, 2021).
USGCRP. (2018). Impacts, Risks, and Adaptation in the United States: Fourth National Climate Assessment, Volume II: [Reidmiller, D.R., C.W. Avery, D.R. Easterling, K.E. Kunkel, K.L.M. Lewis, T.K. Maycock, and B.C. Stewart (eds.)]. U.S. Global Change Research Program, Washington, DC, USA, 1515 pp. doi: 10.7930/NCA4.2018.
U.S. Nuclear Regulatory Commission. (2021). “Vermont Yankee Nuclear Power Station.” Decommissioning Sites by Location of Name. https://www.nrc.gov/info-finder/decommissioning/power-reactor/vermont-yankee.html (August 11, 2021).
VELCO. (2021). Vermont Long-Range Transmission Plan. April 12, 2021 draft. Available: https://www.vermontspc.com/assets/documents/2021Plan_publicreviewdraft.pdf
Vermont Business Magazine. (2021). “Vermont Receives Federal Designation for Alternative Fuel Corridors.” Vermont Business Magazine. https://vermontbiz.com/news/2021/may/20/vermont-receives-federal-designation-alternative-fuel-corridors (July 12, 2021).
VT Agency of Natural Resources. (2021). Vermont Greenhouse Gas Emissions Inventory and Forecast: 1990 – 2017. Agency of Natural Resources: Air and Climate Division. https://dec.vermont.gov/sites/dec/files/aqc/climate-change/documents/_Vermont_Greenhouse_Gas_Emissions_Inventory_Update_1990-2017_Final.pdf (July 21, 2021).
VT Department of Forests, Parks and Recreation. (2019). Vermont Residential Fuel Assessment for the 2018-2019 Heating Season. Vermont Department of Forests, Parks, and Recreation. https://fpr.vermont.gov/sites/fpr/files/Forest_and_Forestry/Wood_Biomass_Energy/Library/2019%20VT%20Residential%20Fuel%20Assessment%20Report%20FINAL.pdf (July 12, 2021).
VT Department of Public Service. (2021). “Act 174 Recommendations and Determination Standards.” https://publicservice.vermont.gov/content/act-174-recommendations-and-determination-standards (August 11, 2021).
WJXT News 4 JAX. (2019). “Money Matters: Average Car Lifespan in U.S. Nearly 12 Years.” https://www.news4jax.com/consumer/2019/06/28/money-matters-average-car-lifespan-in-us-nearly-12-years/#:~:text=Montana%20was%20found%20to%20have,than%20heavier%20vehicles%20like%20trucks (July 12, 2021).
Zhou, Y., Panteli, M., Wang, B., and Mancarella, P. (2020). “Quantifying the System-Level Resilience of Thermal Power Generation to Extreme Temperatures and Water Scarcity.” IEEE Systems Journal 14(1): 749–59.