Water Resources
Download chapter PDF and figures
Authors
Danielle Cook
Forest Ecosystem Monitoring Cooperative, University of Vermont; Americorp
Ned Swanberg
Vermont Department of Environmental Conservation; Flood Ready Vermont
Citation
Cook, D., Swanberg, N., 2021. Water Resources. In Galford, G.L., Faulkner, J. et al. (Eds), The Vermont Climate Assessment 2021. Burlington, Vermont: Gund Institute for Environment at the University of Vermont. DOI: 10.18125/kowgvg.
Table of Contents
- 3.1 Key Messages
- 3.2 Background
- 3.3 Water Supply and Use
- 3.4 Streamflow
- 3.5 Water Quality
- 3.6 Flooding
- 3.7 Resources for Community Members and Planners
- 3.8 Traceable Accounts
- 3.9 References
3.1 Key Messages
- Due to extreme variation in precipitation with our changing climate, periods of prolonged dry-spells and drought, coupled with higher water usage in snowmaking and agriculture could exacerbate low water availability.
- Increases in overall precipitation and extreme precipitation have caused streamflows to rise since 1960. Climate change will further this pattern, although the overall increase in streamflow comes with disruptions in seasonal flows cycles.
- Increases in heavy precipitation jeopardize water quality in Vermont. Storms produce large runoff events that contribute to erosion and nutrient loading. Combined with warm temperatures, this creates favorable conditions for cyanobacteria blooms.
- Increased occurrence of high streamflows increase the risk of flooding that causes damages to many roads and crossing structures. Risk reduction requires addressing outdated and unfit structures.
- Nature-based solutions are an effective, low-cost approach to climate change adaptation. River corridor, floodplain, and wetland protection dampen flood impacts and improve water quality along with green infrastructure.
3.2 Background
Key Point: Historical changes in total precipitation, heavy precipitation events, and temperature have had observable impacts on Vermont’s water resources.
3.2.1 Increasing Water
Precipitation in Vermont and the Northeast has been steadily increasing, although prolonged dry-spells and droughts are more common (see Climate Change in Vermont chapter). Recent evidence of climate change and its impacts give a sense of near-term (10-30 year) trends that are likely to continue. Increasing precipitation is expected to continue in Vermont and throughout the Northeast through the 21st century (Dupigny-Giroux et al., 2018; Guilbert et al., 2014). In Vermont, average annual precipitation has increased by 7.5 inches since the early 1900s, and has been increasing at a rate of 1.4 inches per decade in the same period (see Climate Change in Vermont chapter).
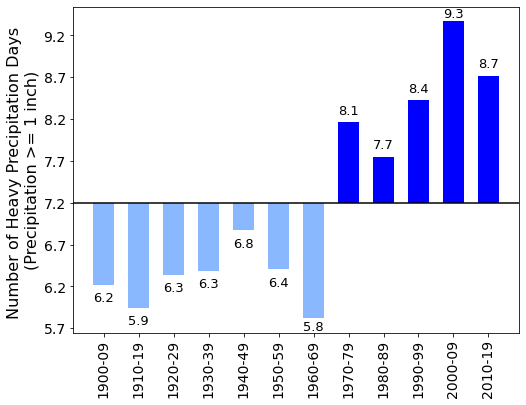
Increases in heavy precipitation events (greater than 1 inch of precipitation a day) are projected to continue throughout New England at a rate of 15% or more compared to the historical baseline (Dupigny-Giroux et al., 2018). Heavy precipitation events have increased in Vermont with decadal averages of 6.2 days/year in 1900s, 5.8 in 1960s, 8.4 in 1990s and 8.7 today (see Climate Change in Vermont chapter). Heavy precipitation results in higher volumes of stormwater runoff (LCBP, 2015), which can carry sediment and nutrients to our streams and lakes. For example, only 6% of the Lake Champlain Basin is impervious surfaces but these developed areas discharge more than other land uses (e.g., agriculture) (LCBP, 2018). Increased runoff drives erosion and moves contaminants that impair water quality to our lakes and rivers.
High-magnitude storm and/or precipitation events increase the likelihood of flooding (Guilbert et al., 2015). Flooding impacts range from property damage to infrastructure failure to loss of human life. How Vermont manages its natural resources, like its floodplains and wetlands, will play a large role in the future under altered conditions. Wetlands and riparian forests can attenuate water flows by holding water during times of extreme precipitation and releasing stored water during times of low flow. These land covers can both reduce flooding and effects of drought.
3.2.2 Water Shortages
At the other extreme, Vermont is beginning to experience more variability in precipitation such as prolonged dry spells and drought (see Climate Change in Vermont chapter). Droughts are projected to become more common in Vermont over the coming century (Betts, 2017). Unseasonable reductions in precipitation puts water supplies at risk in an era when water use is projected to increase for certain sectors. It is noteworthy that 60% of Vermonters use groundwater as their drinking water source (VT DEC, 2018). Natural infrastructure, such as wetlands, may be used to increase resilience as they attenuate flows to mitigate effects of drought.
3.2.3 Water Temperatures
Air temperature increases have been observed in Vermont (see Climate Change in Vermont chapter), and are projected to increase by about 0.5°C per decade through the late 21st Century (Guilbert et al., 2014). Warming winter temperatures will result in less frozen precipitation and earlier spring thaw of snow and ice (Betts, 2017). Annual snowfall has declined by 10 inches relative to the 1960s, even as total precipitation increased; precipitation is falling as rain rather than snow due to warming conditions. Ice-out is also moving earlier by several days on Vermont’s inland lakes (see Climate Change in Vermont chapter).
These temperature increases are reflected in the water temperatures of Vermont’s lakes and rivers. According to measurements taken in ten regions of Lake Champlain, summer surface water temperatures have increased significantly in the last 50 years. An analysis of August lake temperature from 1964-2009 yielded an increase of 1.6 to 3.8°C (up to 0.085 °C/year). Summer air temperatures in the Lake Champlain Basin increased by about 0.037 °C/year from 1976-2005 (Smeltzer et al., 2012). Summer lake temperatures matched and even surpassed the rate of increase for air temperatures, illustrating the effect of warming climate. Researchers attributed these results to declining ice cover in Lake Champlain. With the absence of ice, the surface layers of the water begin to absorb radiation early in the spring, even as lower strata remain cooler (Smeltzer et al., 2012). Warming temperatures further enforce thermal stratification because warmer water is less dense, so it remains on top, resisting mixing of the layers (US EPA, 2013).
There is also evidence that temperatures in many rivers and streams have increased over time in the United States. Stream temperatures are subject to many factors, including groundwater inputs, geography, dams, and thermal discharge from plants, on top of air temperature and solar radiation (Kaushal et al., 2010). Water temperature does not fluctuate like air temperature, since cool groundwater inflows (e.g., wetland seeps) tend to stabilize river temperatures (Hodgkins & Dudley, 2011). However, despite differences in environmental conditions, many streams have shown increases consistent with long-term warming (Kaushal et al., 2010) This has especially negative impacts for aquatic biota, like cold-adapted fish species (Hodgkins & Dudley, 2011) (see Fish and Wildlife in Vermont chapter).
3.3 Water Supply and Use
Key Point: Water supplies are already under stress in some areas of Vermont, and usage will likely increase for certain sectors. Increased occurrence of drought due to climate change will exacerbate this effect.
Water is sourced from surface water, such as lakes, rivers, and wetlands, and groundwater (water stored in the soils and bedrock). Precipitation runs off into surface waters, and it recharges groundwater that in turn supplies base flow to surface sources. About 60% of Vermonters rely on groundwater for drinking (VT DEC, 2018). Vermont’s only thermoelectric power plant, Entergy Vermont Yankee, depended almost exclusively on surface water (VT DEC, 2018). Entergy Vermont Yankee withdrew over 340 million gallons of surface water every day in 2010. It was decommissioned in 2014 (VT DEC, 2018) (see Energy chapter).
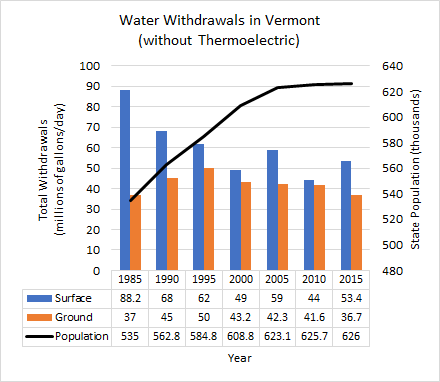
Water use in Vermont has decreased steadily over time (Figure 3-1) and dramatically from 2010 to 2015 due to the Entergy Vermont Yankee power plant’s closure (USGS, 2021). This is consistent with trends throughout the United States, where water withdrawals peaked in 1980 and have remained relatively steady with modest decreases, despite population growth, more widespread irrigation, and industrial usage. This demonstrates the power of efficient water systems and conservative usage behavior (USGS, n.d.).
Freshwater resources undergo stress in certain areas and/or times (e.g., dry spells) in Vermont (USGS, 2021). For example, the town of Brattleboro utilizes a surface water reservoir that is often depleted during times of drought or high demand. The town relies on backup groundwater wells (Brattleboro Public Works Department, n.d.)
Surface water and groundwater sources are both vulnerable to changes in climate. During the summer months, there is an increased probability of drought and warmer temperatures drive higher evaporation levels. Combined with low precipitation, dry conditions result in reduced surface water and groundwater supplies (Betts, 2017). Communities like Brattleboro that rely on already-stressed water sources will be put in increasingly precarious positions. Conservative use and efficient water infrastructure have already proved effective and may be vital in the future (see Community Development chapter).
Warming temperatures also lead to decreased winter snowpack and earlier spring snowmelt (see Climate Change in Vermont chapter). Historically, groundwater levels peak in March or April due to gradual recharge from snowmelt (Dudley & Hodgkins, 2013). With less snowpack and earlier snowmelt, groundwater may be more easily depleted moving into the summer months during dry conditions. Conversely, the increase in Vermont’s heavy precipitation events (see Climate Change in Vermont chapter) do little to recharge groundwater stores. The vast majority of groundwater recharge comes from the small, frequent precipitation events, whereas high-intensity storms lend more to stormwater runoff into streams, rivers and lakes (LCBP, 2015).
3.3.1 Winter Recreation Water Use
As the climate changes, demand for water may increase in certain industries. Warming winter temperatures coincide with higher likelihood that winter precipitation will fall as rain instead of snow (Betts, 2017). For Vermont’s busy winter sports industry, this threatens to shorten the season suitable for winter sports and reduce snowpack (see Recreation and Tourism chapter). Guilbert et al. (2014) estimated that annual snowfall will decrease roughly in half (47% to 52% by the late 21st Century) for several ski resorts in the Lake Champlain Basin.
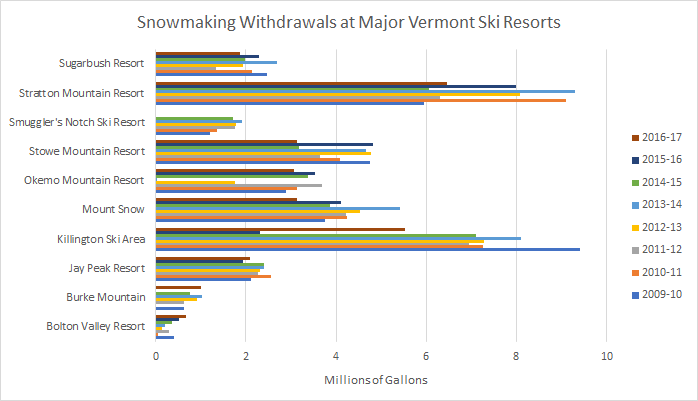
In Vermont, natural snowfall is commonly supplemented with human-made snow which requires a reservoir of stored water; many winter resorts have artificial or natural water reservoirs for quick withdrawals, some drawing from multiple surface water sources (Figure 3-2) (Wilson et al., 2018). Snowmaking withdrawals consistently reach 30 million gallons per winter season (defined here as November through February of the next year) across ten of Vermont’s major ski areas.
Winter temperatures are rising faster than any other season (see Climate Change in Vermont chapter), so natural snowfall and suitable conditions for supplemental snowmaking will both decrease by the end of the 21st Century (Guilbert et al., 2014). Snowmaking requirements are projected to increase significantly for many of Vermont’s resorts, potentially by 25% by 2040 (Dawson & Scott, 2007). Water availability, in addition to temperature suitability, must be recognized in considering the viability of the winter sports industry in the Northeast under climate change (Wilson et al., 2018). February Median Flow (FMF) is a particularly important metric for water withdrawals from Vermont rivers, as the FMF value determines the minimum flow rate that must be maintained (at or above) when water is withdrawn for snowmaking per Vermont rules (VT ANR, 1996) (see Recreation and Tourism chapter).
3.3.2 Agricultural Water Use
Water usage is incredibly important in agriculture, especially as the climate changes. In Vermont, 85-90% of farms rely on groundwater sources for agricultural purposes (VT DEC, 2018). The amount of land in Vermont that uses irrigation has almost doubled since 1995, yet water usage for irrigation has remained relatively stable in those twenty years, which is consistent with long-term national trends (Figure 3-3) (USGS, n.d.).
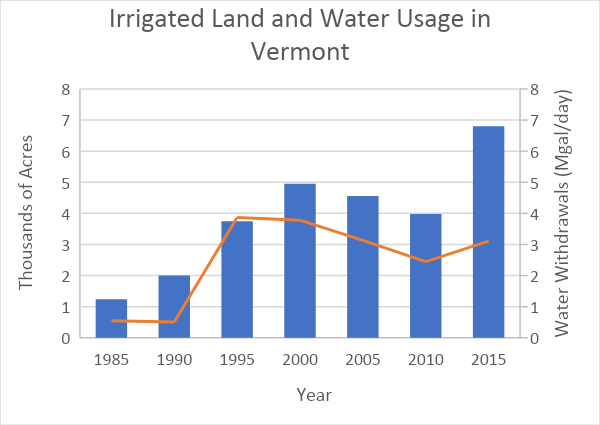
Efficient irrigation systems have been key to maintaining crops without draining water supplies (Schaible & Aillery, 2017). However, these increases represent only a small proportion of the 1.3 million acres of land in agricultural use in 2016 in Vermont. Of the 535,100 acres that was cropland, irrigated lands amount to only about 1.3%, considering that about 6800 acres of land was irrigated in 2015 (Farmland Information Center, 2016).
Future changes in climate, including variability in precipitation, summer dry spells, and increased evapotranspiration, are expected to drive up implementation of irrigation systems in the Northeast and throughout the U.S. (Schaible & Aillery, 2017; Wolfe et al., 2018). Efficient water usage strategies will continue to be important in the future to cope with changing conditions (Schaible & Aillery, 2017) (see Agriculture and Food Systems chapter).
3.4 Streamflow
Key Point: Average annual streamflow has increased in Vermont over time and across most seasons. Further increases can be expected under a wetter climate with intense storm events, creating challenges for water retention and flood risks.
Changes in precipitation and storm patterns are evident in Vermont’s waterways the past few decades. Streamflow can be used as an indicator because the amount of precipitation directly affects how much water ends up in streams and rivers. Base flow of streams is derived long-term from groundwater storage, bank storage, and landscape sources like lakes, ponds, and wetlands that drain in. Storm flow adds on to the base flow when precipitation runs off into the stream in the short-term (Hodgkins & Dudley, 2011). Following a given precipitation event, runoff quantities depend on many factors, like land use, topography, vegetation, and soil properties. Urban areas with impervious surfaces and lands lacking vegetation allow more runoff than those that are forested (LCBP, 2015), although given the small total area in impervious surfaces the changes in runoff are largely attributable to increased precipitation.
Beyond an indicator of climate change, streamflow is a measure of water availability and flow power. For example, snowmaking guidelines in Vermont keep a discharge threshold to determine water supply for withdrawals (VT ANR, 1996) (see Recreation and Tourism chapter). Similarly, the U.S. Fish and Wildlife Service uses streamflow as an indicator of critical habitat for native fish (Lang, 1999). Flooding events can also be directly monitored by assessing discharge levels, and drought periods are likewise characterized by low flows (see Climate Change in Vermont chapter). Therefore, streamflow is a direct measure of how much water is running through a waterway, which has practical, ecological, and economic ties.
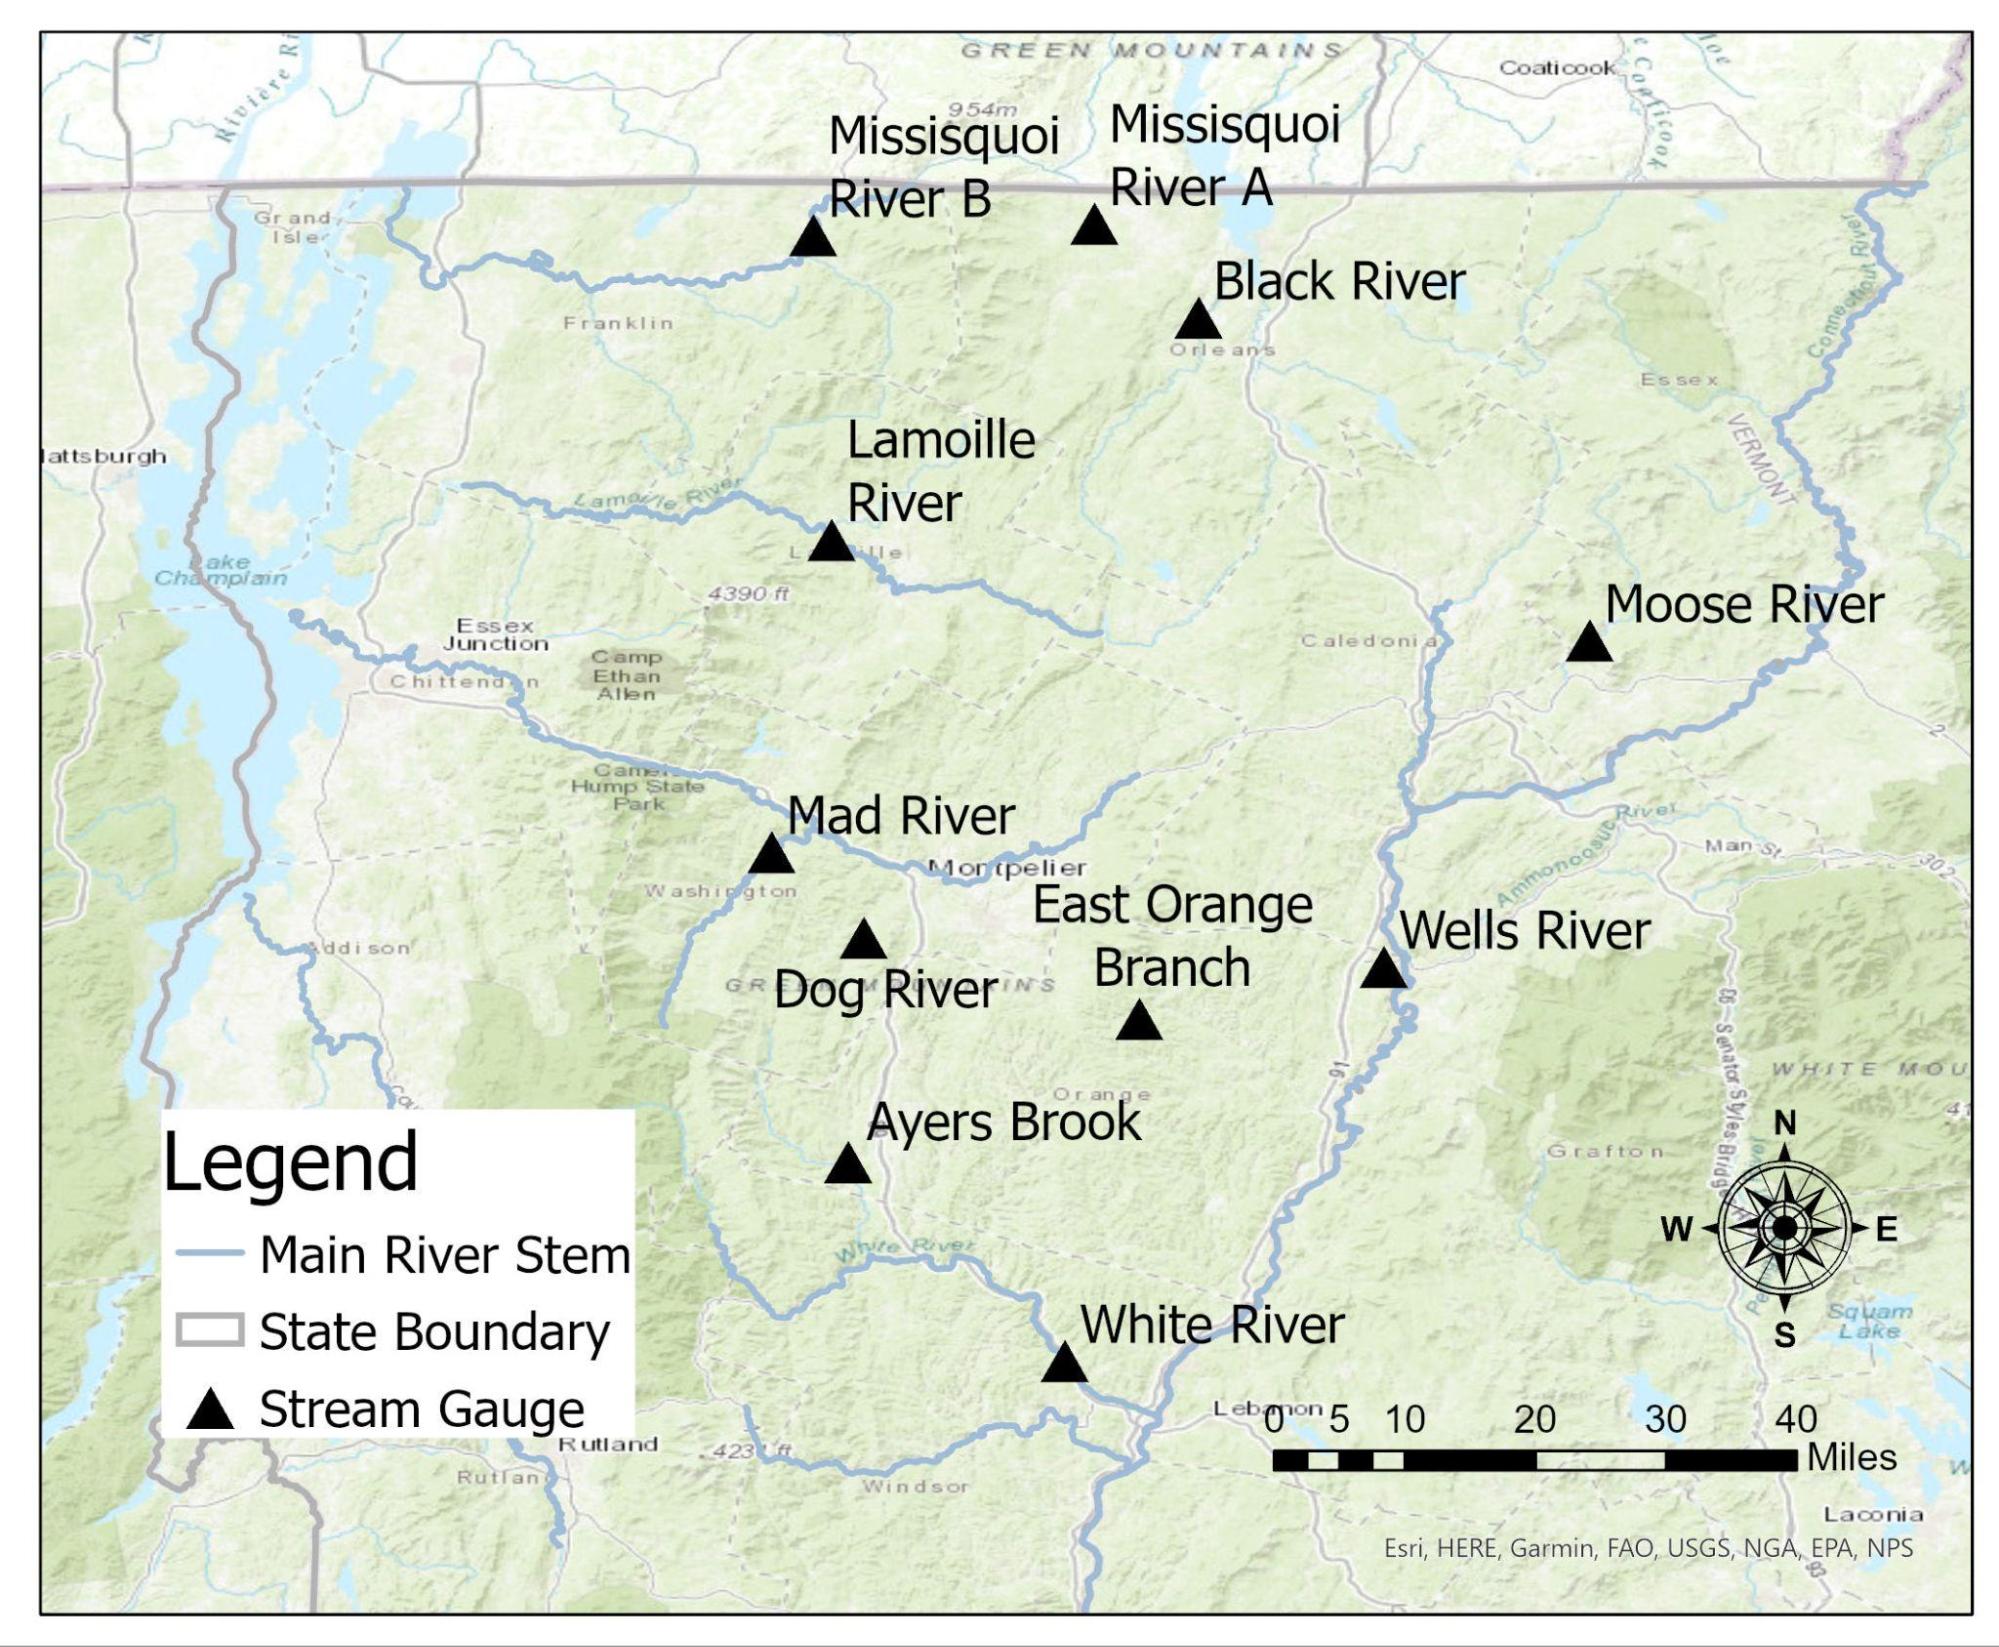
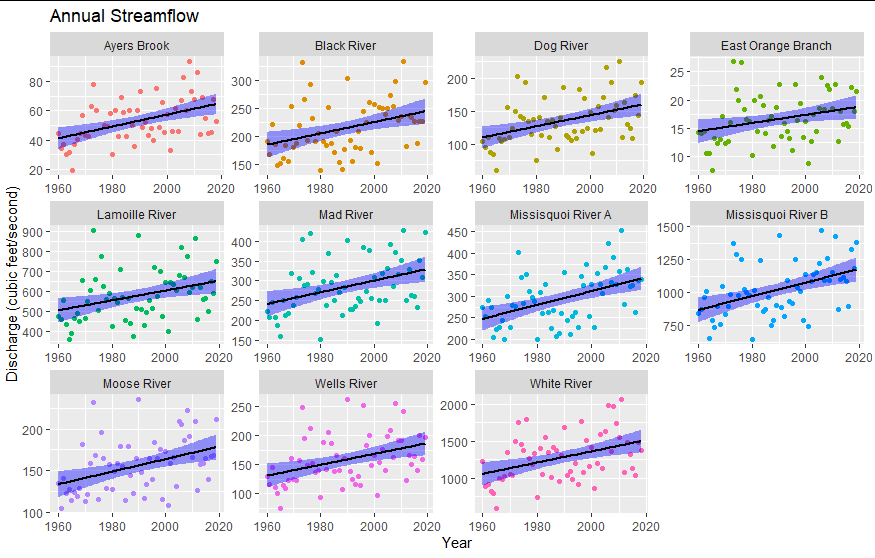
124 USGS gauges are installed in streams and rivers throughout Vermont to measure discharge, the amount of water that passes by the point of the gauge in a certain time interval in cubic feet per second (CFS). Of these, a subset of six belong to the Hydro-Climatic Data Network, chosen by the USGS for climatic study due to limited outside influence, such as impoundments or diversion. The other five stations included in this analysis are approved in other literature as having minimum external influences (Hodgkins, 2010) (Figure 3-4). Therefore, the trends observed at these stations can be attributed to changes in climate.
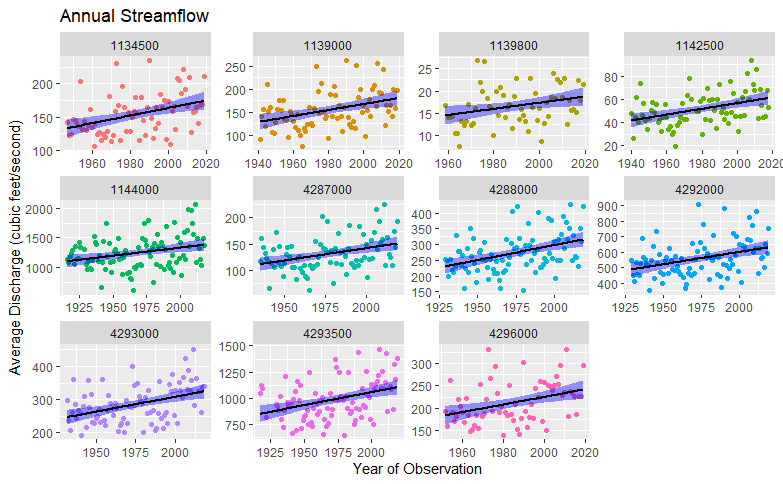
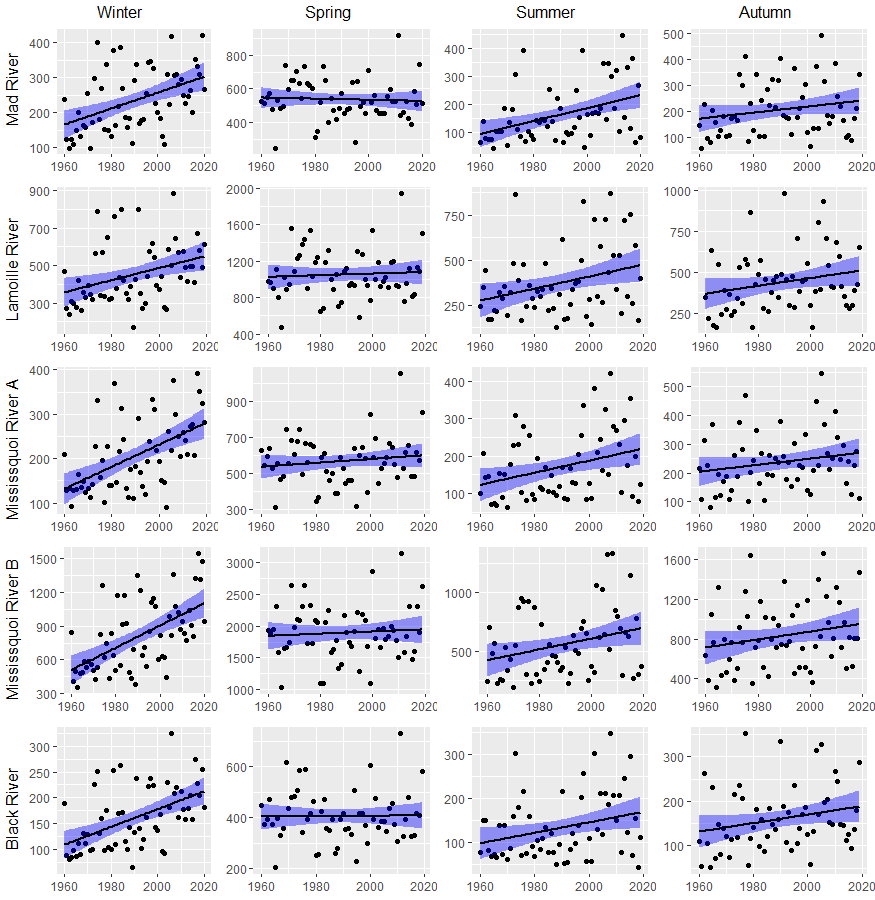
All 11 streamflow gauges showed statistically significant (p<0.05, Mann’s Kendall) increases in average annual streamflow since 1960 (Table 3-1) and for their full period of record. For 9 out of 11 sites, the trend was very significant (p<0.01, Mann’s Kendall). This is consistent with increased annual precipitation and runoff due to climate change (see Climate Change in Vermont chapter). This trend is likely to continue with increased total precipitation and more frequent storm events (Guilbert et al., 2015).
| USGS Site ID | Site Name | Mann Kendall, p-value (since 1960) | ||||
|---|---|---|---|---|---|---|
| Annual | Winter | Spring | Summer | Autumn | ||
| 01134500 | MOOSE RIVER AT VICTORY | 0.0009 | 9.55E-05 | 0.7258 | 0.0206 | 0.0228 |
| 01139000 | WELLS RIVER AT WELLS RIVER | 0.0015 | 0.0015 | 0.9851 | 0.0006 | 0.0162 |
| 01139800 | EAST ORANGE BRANCH AT EAST ORANGE | 0.0216 | 5.91E-05 | 0.1913 | 0.0040 | 0.0067 |
| 01142500 | AYERS BROOK AT RANDOLPH | 0.0005 | 0.0001 | 0.6192 | 0.0004 | 0.0120 |
| 01144000 | WHITE RIVER AT WEST HARTFORD | 0.0023 | 8.76E-05 | 0.7162 | 0.0004 | 0.0419 |
| 04287000 | DOG RIVER AT NORTHFIELD FALLS | 0.0009 | 0.0002 | 0.7450 | 0.0005 | 0.0287 |
| 04288000 | MAD RIVER NEAR MORETOWN | 0.0015 | 0.0001 | 0.2322 | 0.0006 | 0.1243 |
| 04292000 | LAMOILLE RIVER AT JOHNSON | 0.0041 | 0.0006 | 0.9847 | 0.0326 | 0.0794 |
| 04293000 | MISSISQUOI RIVER NEAR NORTH TROY | 0.0005 | 7.75E-06 | 0.6361 | 0.0174 | 0.1152 |
| 04293500 | MISSISQUOI RIVER NEAR EAST BERKSHIRE | 0.0003 | 3.81E-06 | 0.9036 | 0.0296 | 0.0817 |
| 04296000 | BLACK RIVER AT COVENTRY | 0.0058 | 9.89E-06 | 0.7741 | 0.0502 | 0.0406 |
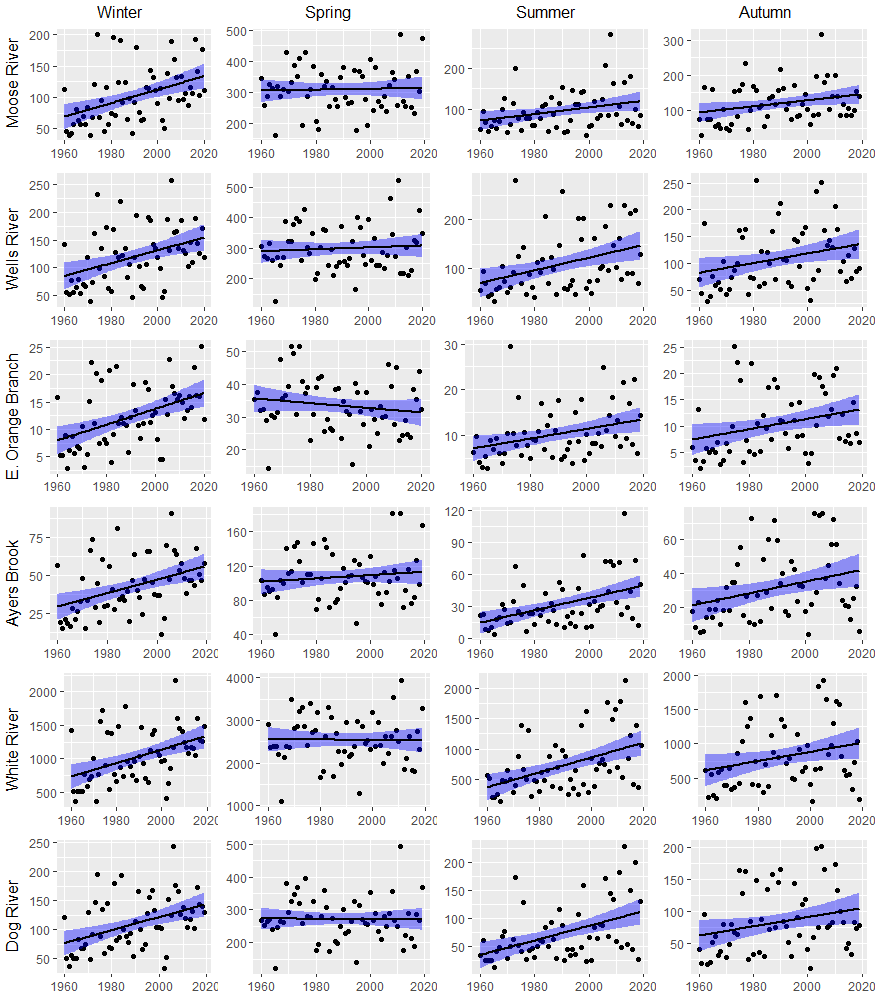
Discharge was also analyzed by meteorological season to see at what times of year these trends are most evident. Streamflow levels naturally vary between seasons. Absolute flow values are highest in the spring due to melting snowpack and precipitation running off of saturated or frozen soils. Following leaf-out of deciduous vegetation, evapotranspiration picks back up, producing lower base flows in the summer, though storms in the summer and autumn add on. Winter precipitation falling as snow accumulates before returning to the watersheds in the spring as snowmelt (Hodgkins & Dudley, 2011) (see Climate Change in Vermont chapter). This seasonal cycle is important for water availability, such as for snowmaking, and ecological function, such as migrating fish species (Dudley et al., 2017).
Monthly data was divided into four seasonal intervals: December to February for winter, March to May for spring, June to August for summer, and September to November for autumn. A significant positive trend (p<0.05) was observed for all sites in winter and summer, and for 10 out of 11 sites in autumn. These trends are consistent with observed increases in annual and heavy precipitation during these seasons (see Climate Change in Vermont chapter).
Spring is the only season in which significant changes in streamflow were not observed, with trends remaining relatively steady (p>0.05, Mann’s Kendall). This is surprising because spring precipitation has increased over time like the other seasons (see Climate Change in Vermont chapter). One explanation for this is based on temperature changes, not precipitation. Temperatures are warming most significantly during winter, with total snowfall trending downwards since the 1960-70s, but precipitation trending upwards. Therefore, winter precipitation is falling more often as rain rather than snow, leading to less snow accumulation (see Climate Change in Vermont chapter). This snowpack is also melting earlier in the year. Dudley et al. (2017) analyzed historical trends in snowmelt-related streamflow timing using the winter-spring center of volume date, or the date when half of the volume of water for the winter and spring seasons has passed the gauge. They found that in the Eastern United States, the average for this date has advanced by over 8 days between 1940 and 2014, driven by February-May temperature increases. Therefore, water that is typically stored as snowpack, which later melts contributing to spring streamflow, is now falling as rain in the wintertime. The snowpack that does form is melting earlier in the winter-spring season, potentially contributing to the steady trend exhibited by spring streamflow over time.
3.5 Water Quality
3.5.1 Nutrient and Sediment Loading
Key Point: Storms produce large runoff events that contribute to erosion and nutrient loading, which jeopardizes water quality.
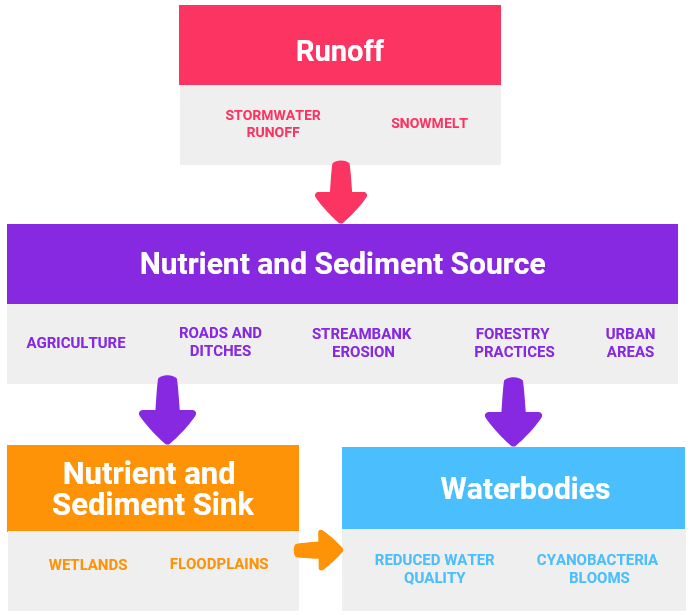
Greater amounts of runoff not only leads to higher streamflows; it also drives erosion and carries pollutants and sediments into Vermont’s waterways. In 2018, nutrients were the cause of impairment for 54.8 miles of Vermont’s streams and rivers, and sedimentation impaired 63.1 miles (VT ANR & VT DEC, 2018). Lake Champlain Basin (including NY and VT), for example, has a ratio of 18:1 land to water; that is a primary reason water quality challenges result from land-based nutrient and sediment inputs. Vermont’s lakes and ponds, as well as wetlands, can be hardened by sedimentation and excess nutrients. For example, buildup of sediments can alter hydrology, or invasive plants are able to colonize disturbed wetlands. Storms in particular contribute large volumes of nutrients and sediments in short amounts of time (Stockwell et al., 2020), and a reduction in the frozen period for soils may make them more susceptible to erosion. Segments of seventeen waterbodies (rivers or lakes) in Vermont are impaired due to stormwater runoff, while twenty-five are impaired by nutrients or nutrients and sediment and fifteen by sediment inputs (VT DEC, 2018). Therefore, as the climate changes and heavy precipitation events increase, these individual storm events play an oversized role in water quality impairment.
In Vermont, phosphorus is often considered the most troublesome pollutant. Phosphorus pollution comes from point sources like wastewater treatment centers, as well as non-point sources such as stormwater runoff and agricultural runoff. Phosphorus levels are over the allowed limit in many waterbodies, mostly from non-point sources. Reducing inputs from runoff, while far more difficult than for point sources, is imperative (Smeltzer et al., 2012). In 2016, the US Environmental Protection Agency (EPA) found that the leading contributor of phosphorus inputs into Lake Champlain is the agricultural sector, primarily from cropland and soil erosion (US EPA, 2016). Phosphorus accumulation in agricultural soils is a legacy of Vermont’s agricultural identity, which cannot be avoided even with sharp reductions in current imports. Phosphorus continues to accrue by 5 kg per hectare per year in Vermont due to applications of manure and fertilizer, as part of the net importation of phosphorus in animal feed and fertilizer (Wironen et al., 2018) yet developed lands contribute twice the phosphorous load as agricultural lands (0.51 metric tons per square mile and 0.25 metric tons per square mile, respectively) (LCBP, 2018).
When soils erode, the sediments are released along with the nutrients they were trapping. Erosion on backroads, poorly managed ditches, and forestry practices are other significant contributors of phosphorus, but less so than agriculture (LCBP et al., n.d.; US EPA, 2016). Streambank erosion also contributes nutrients and high sediment volumes from unstable streams. Channels that have become artificially straightened become more powerfully erosive of stream banks causing incision (Kline & Cahoon, 2010). Approximately 75% of assessed river reaches in Vermont have become disconnected from their floodplains and thus are more prone to erosion (Henzel, 2016; Kline, 2016; Kline & Cahoon, 2010).
As more high-intensity storms occur in Vermont, large runoff events will significantly impair water quality without substantial action to use nature-based solutions to minimize stormwater runoff (see Community Development chapter). A study examined sediment released by Tropical Storm Irene in the Mad River, Vermont watershed. Soil samples and aerial imagery pre- and post- Tropical Storm Irene were used to calculate how much sediment and phosphorus were released due to erosion from high flows. The results suggest that this one extreme event delivered as much sediment and phosphorus into the stream as is normally exported over an entire year (Ross et al., 2019).
Adaptation measures, particularly in developed areas and farmlands, can help mitigate runoff volume and velocity. Payment for Ecosystem Services programs are an option for reducing phosphorus loading (see Agriculture and Food Systems chapter). Wetlands and floodplains are vital natural features that preserve water quality, and restoration is a cost-effective mitigation measure, such as in marginal farmlands (Rousseau, 2020). Implementation of green stormwater infrastructure can greatly reduce runoff to preserve water quality (LCBP, 2015) (see Community Development chapter).
Box 3.1 – The Value of Water Quality in Lake Champlain
Though water seems a plentiful resource in Vermont, clean water is vital to its citizens’ lifestyles and livelihoods. Lake Champlain alone is an economic powerhouse in terms of property value, tourism revenue, and employment opportunities. A 2015 study found that for the four counties in Vermont adjacent to Lake Champlain, just a one-meter decrease in water clarity has consequences. A one-meter decrease means that the water is less clear at shallower depths due to sediments and algae growth; this is measured by lowering an object into the water and recording the depth when it disappears. An extrapolated model shows that this loss in water quality would in turn lead to a loss of approximately 195 full-time jobs, a $12.6 million reduction in tourism expenditures, and a total economic reduction of nearly $16.8 million (Voigt et al., 2015).
3.5.2 Floodplains and River Corridors
The floodplain is an area outside a waterbody where floodwaters can go. When rivers are well connected to their floodplains, these riverside areas can accommodate the overbank flow, capture sediment, and store floodwaters to reduce the volume and peaks of flows experienced in downstream reaches. Floodplains host moist deep and varied soils and unique natural communities, and these stone-free floodplain soils are valued for agriculture and forestry. Sediments and nutrients carried in the water settle out onto the floodplain instead of routing back to the waterbody; maintaining water quality is an important ecosystem service provided by floodplains (Figure 3-7).
Stream and river channels adjust dynamically to accommodate the flow of water, sediment, and debris. River Corridors identify the minimum lateral area needed for stream and river channels to freely adjust and manage these forces. River Corridors in Vermont are mapped to include the channel meander belt and room for a stable vegetated bank (Kline & Cahoon, 2010). This vegetation helps to prevent streambank erosion (Singh et al., 2018).
River corridors and floodplains provide foundational ecosystem services with critical public safety, fiduciary, water quality, habitat, social and economic benefits. However, in the Northern hemisphere, over 95% of streams have been modified by human activity (Singh et al., 2018). Historical land use choices have involved channel and floodplain manipulation to straighten, dredge, armor, and berm rivers to protect riverside infrastructure. A straightened channel becomes more erosive and can lose functional connection with its floodplain. Within Vermont, over 75% of assessed streams have lost some degree of connection to the floodplain and are incised (Henzel, 2016).
3.5.3 Wetlands and Water Quality
Wetlands are inundated by surface water or groundwater seasonally, such as vernal pools, or year-round. They serve a variety of functions and values to human society, in addition to supporting robust plant and wildlife communities (see Fish and Wildlife in Vermont chapter) (VT DEC, 2019).
The impacts of climate change on wetlands are poorly understood, especially for freshwater inland wetlands like those in Vermont. Wetlands in Vermont do not face the same threats as coastal wetlands from saltwater intrusion, or wetlands in areas prone to frequent drought and wildfire. However, regardless of geographic region, wetland functionality can be impaired by increased temperatures, drought and flooding events, and carbon dioxide increases (Junk et al., 2013; Moomaw et al., 2018). Ephemeral wetlands, or vernal pools, depend largely on the length of time they are inundated, or the hydroperiod. Drought and flooding events can shorten or prolong the hydroperiod, making it less suitable for some wildlife that depend on them for habitat or breeding (Brooks, 2009)(see Fish and Wildlife in Vermont chapter). Wetlands’ vulnerability to changes in climate goes in hand with the natural mitigation services they offer.
Wetlands play an important role in moderating the effects of climate change in terms of water quality. (Adusumilli, 2015; Junk et al., 2013; VT DEC, n.d.). Wetlands serve as natural filtration systems for nutrients and sediments (Carr et al., n.d.; VT DEC, 2019). The binding roots of wetland plants can remove up to 90% of sediments present in runoff or streamflow (VT DEC, n.d.). Excess nitrogen and phosphorus are taken up by wetland plants and recycled through the system (Junk et al., 2013; VT DEC, 2019). Because of these benefits, wetlands are regarded as a natural solution to impaired water quality and eutrophication (Lester et al., 2019; VT DEC, 2019).
A study in the Lake Champlain Basin was dedicated to optimizing wetland restoration to reduce phosphorus export (Lester et al., 2019). The researchers developed a framework based on ecosystem service modeling; how much phosphorus could be reduced for the lowest cost? They found that phosphorus exports throughout the basin could be reduced by 2.6% for a $50 million budget, and by 5.1% for a $200 million budget. With access to finer spatial resolution data, in order to locate “hotspots”, phosphorus reduction could potentially reach twice that for the same budget. This study highlights the major role Vermont’s wetlands take in clean water.
Another important way that wetlands increase resilience to climate change is through carbon sequestration. Carbon dioxide in the atmosphere is absorbed by wetlands, stored in plant biomass for decades and in its soils for potentially thousands of years (Carr et al., n.d.; Milligan et al., 2019). The exact amount of carbon stored is difficult to determine, and it varies by location, wetland size, and other factors. Wetlands in the Northeast and Midwest store more carbon than any other region in the United States; one study estimated about 475 metric tonnes per hectare in the soils alone (Nahlik & Fennessy, 2016). Another calculated that wetland plants sequester over 8 tonnes of carbon per hectare every year, though for a specific wetland in Connecticut (Milligan et al., 2019). Wetlands also release carbon dioxide, through respiration, and emit methane, but they are largely considered valuable carbon sinks rather than sources. Management decisions are key to maintaining wetlands as carbon sinks. In Vermont, over 35% of wetlands have been lost, mainly due to agricultural development (Dahl, 1990). Wetland drainage and alteration exposes the soils, liberating and releasing carbon into the atmosphere, turning a major carbon storage tank into a source instead. Newly created freshwater wetlands can take decades to centuries to become a carbon sink due to methane emissions, as roots and microbes accumulate (Moomaw et al., 2018). Wetland degradation has other far-reaching consequences, such as habitat loss for plants and wildlife, and functions for water supply, water quality, and flood control are also impaired.
3.5.4 Algae and Cyanobacteria Blooms
Key Point: Climate change creates favorable conditions for cyanobacteria blooms, which impact recreation, public health, and wildlife.
Nutrients feed algae growth in water bodies, which reduces water clarity and oxygen levels. Heavy precipitation produces large runoff events that carry these nutrients, particularly phosphorus, into Vermont’s waterways. Combined with warming temperatures, climate change could support the warm, nutrient-enriched environment that algae thrive in at the expense of fish and wildlife (LCBP, 2015).
Some algae are very dangerous to consume or come into contact with (see Human Health chapter). Cyanobacteria, or blue-green algae, are common lake organisms, but some produce cyanotoxins. Cyanobacteria blooms, or harmful algal blooms, are dense accumulations of blue-green algae. They have been observed in Lake Champlain since the 1970s, but were not consistently monitored until recently (Figure 3-8) (Shambaugh, 2020). They have dangerous health effects on humans and wildlife, and lead to disruptions in recreational activities when active blooms occur. In 2020, there were a record 44 beach closure days due to cyanobacteria blooms, compared to 9 in 2015 (VPR, 2020).
Climate change is expected to favor cyanobacteria growth, even over other types of algae. Recent research suggests that warming water temperatures lend cyanobacteria a competitive advantage, since certain harmful algae can grow better than non-harmful algae at relatively high temperatures (US EPA, 2013). Additional complexities include increasing chloride levels in lakes (Dugan et al., 2017; Smeltzer et al., 2012) that can play a role in cyanobacteria as well (Paerl & Huisman, 2008); chloride inputs come from applications of salt or brine to minimize ice on roads, which could be increasingly needed to manage conditions as winter precipitation transitions from snow to rain/ice (see Climate Change in Vermont chapter).
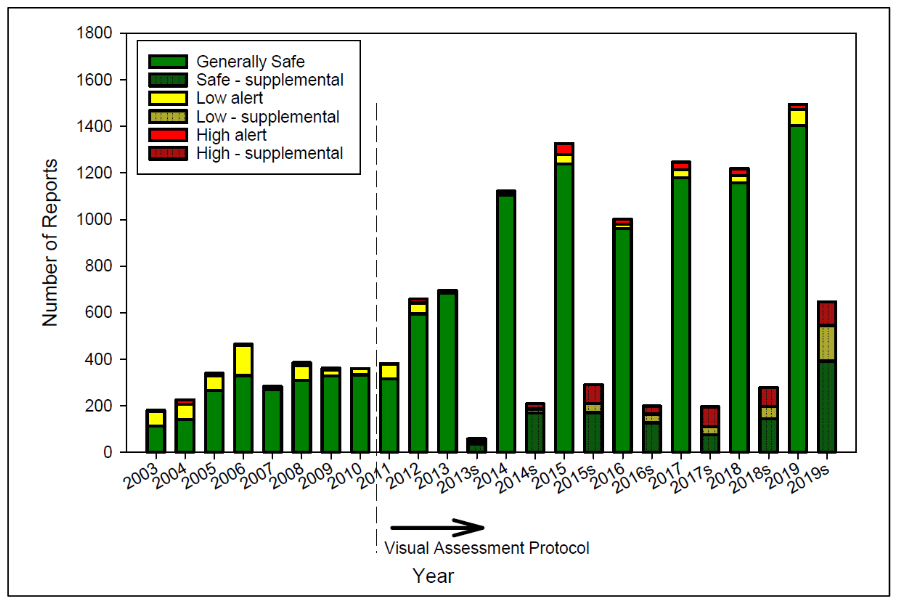
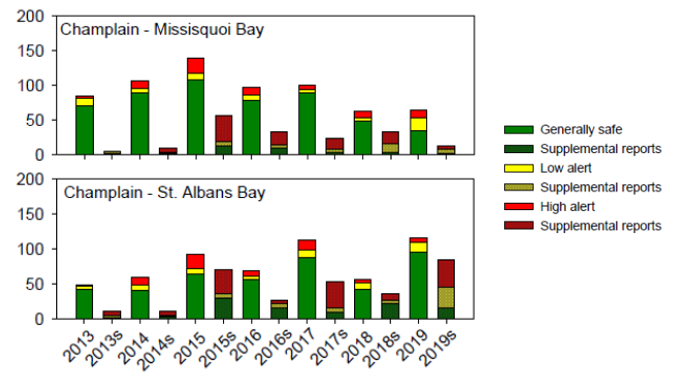
Cyanobacteria blooms are likely becoming more common in Vermont (Figure 3-8). Northeastern sections of Lake Champlain have seen increases in cyanobacteria prevalence since the 1970s because they are phosphorus-impaired. For many of these segments, like Missisquoi Bay and St. Albans Bay (Figure 3-9), cyanobacteria have outcompeted other phytoplankton (Smeltzer et al., 2012). Certainly, Vermont’s 2019 cyanobacteria monitoring program produced a higher number of total reports and alert reports than previous years (Shambaugh, 2020). All reports confirm the presence of cyanobacteria, but alert reports indicate larger amounts of cyanobacteria that could pose safety threats. Detailed tracking of dissolved oxygen, temperature, and blue green algae phyococyanin in St. Albans and Missisquoi Bays are available from a University of Vermont EPSCOR program.
As the climate changes, warming lake temperatures and increased runoff can create favorable conditions for cyanobacteria to bloom (Smeltzer et al., 2012). Increases in bloom occurrence and severity can be expected while these trends continue to create a suitable environment.
3.6 Flooding
Key Point: Damage from high flows is the single most costly type of disaster in Vermont, primarily due to the erosive power of water. Many roads and culverts are in conflict with the room needed by streams and rivers. River corridor and floodplain protection is critical to maintain floodplain function.
The most common recurring hazard event in Vermont is flooding. Damage is usually associated with the rise of river or lake levels and fluvial erosion, in which streambed and streambank erosion result in physical changes to the width and depth of the channel. Flash flooding can occur in small areas when a large amount of precipitation falls in a short period of time, often due to rapid rise of river levels with runoff from entrained thunderstorms. Over 75% of monetary flooding damages are due to fluvial erosion in Vermont (VT Emergency Management, 2018). Roads, crossings, homes, and businesses have been damaged and lives have been lost (State of Vermont, 2021).
Vermont has already seen increases in precipitation and streamflow that produce flooding conditions. Now a decade since the 2011 flooding events, it is important to not forget the insight gained. First, in the spring of 2011, high temperatures and rain brought on rapid melting of a deeper-than-average snowpack leading to widespread flooding in Lake Champlain tributaries in western Vermont and in the eastern Adirondacks. Though flood was not necessarily severe in any one tributary (with exceptions), it was the widespread nature of flooding in so many of the Lake Champlain tributaries that caused Lake Champlain to rise rapidly and to a high stage– a record-breaking 103 ft above sea level, remaining above flooding level (100 ft above sea level) for two months (Betts, 2017; International Lake Champlain-Richelieu River Study Board, 2019; LCBP, 2013). A summary of this flooding event and suggestions for flood preparation are provided by the International Lake Champlain-Richelieu River Study Board (International Lake Champlain-Richelieu River Study Board, 2020).
This major flooding event was subsequently overshadowed by what followed in August: Tropical Storm Irene. High spring-summer precipitation and streamflow levels, combined with soils that were already very wet, allowed for severe flooding and damage across central and southern Vermont (Betts, 2017). Tropical Storm Irene led to over $1 billion in flood-related losses, 1500 displaced families, and 3500 residences damaged (Gourevitch et al., 2020). Flooding exceeded the 1% annual occurrence threshold, or a 1% probability that a flood of that magnitude would occur in a given year, in most areas affected and even the 0.2% value in some areas (Anderson et al., 2017).
The flooding events of 2011 will occur again, like the Great Vermont Flood of 1927 or the 1938 New England hurricane. There has already been an observed increase in watershed discharges (LCBP, 2015; Schiff et al., 2015) and, by design, the best contemporary Flood Insurance Rate Maps do not characterize likely future flooding conditions. Under likely climate conditions, augmented precipitation and runoff are anticipated (Guilbert et al., 2014). Rapid snowmelt in the spring, if there is substantial snowpack, can increase flooding conditions. As snow loading diminishes, frozen soil conditions will affect traditional spring flooding patterns including rapid river ice-melt. As high-magnitude storms are expected to occur more frequently, there is higher risk of costly, recurring flooding (Guilbert et al., 2015). The flooding events of 2011 may serve as a warning for what is to come and emphasize the need for action.
3.6.1 Floodplains and River Corridors
Key Point: Restoring and maintaining functional floodplains and river corridors are important in terms of climate-change induced flooding vulnerability and water quality.
Floodplain integrity is extremely important to flood mitigation in Vermont (Box 3.2). Currently only a third of communities in Vermont protect River Corridors and/or floodplains from adverse impacts, and very few have established protections for woody riparian buffers along banks (State of Vermont, 2021). Forested watersheds offer multiple benefits in terms of flooding mitigation by intercepting rainfall and detaining snowmelt. Forests promote gradual groundwater infiltration and return water to the atmosphere, whereas deforested landscapes allow fast runoff that leads to earlier storm peaks and damaging flows (see Climate Change in Forests chapter) (State of Vermont, 2021). In developing areas, where impervious surface is increasing, most communities in Vermont do not account for increases in offsite storm discharge in their development standards. Flood damage avoidance in Vermont requires more widespread adoption of “no adverse impact” standards to support the natural and beneficial functions of river corridors and floodplains.
As the climate changes and heavy precipitation increases, along with extreme events like Tropical Storm Irene, river corridor and floodplain protections are the least costly opportunity to avoid the loss of existing floodplain functions and heightened damages. In some locations, opportunities for disaster risk reduction may combine both the removal of buildings at risk as well as the re-connection of floodplains to restore ecological services. Many floodplain restoration operations employ functional floodplain connectivity measures and revegetation. Reconnecting floodplains will lead to improved accessibility between the stream and floodplain, such that sediments, and nutrients can be deposited. Revegetation aims to increase bank stability, reducing erosion, and it allows less runoff of sediments and nutrients into the stream (Singh et al., 2018). The assessment and prioritization of these restoration investments should consider both the protection of existing floodplain functions as well as the likely long-term value.
3.6.2 Wetlands and Flood Resilience
Key Point: Wetland conservation and restoration result in many ecosystem services and increase flood resilience.
Wetlands are critical points of flow reduction; they temporarily store stormwater and floodwater, then release them gradually, dampening high discharge. Wetlands decrease flood peaks by as much as 80% (VT DEC, n.d.). As aforementioned, over 35% of wetlands in Vermont have been lost, mainly due to agricultural development (Dahl, 1990). Complete removal of wetlands can result in a 200% increase in peak flows (Watson et al., 2016).
Therefore, wetland mitigation and restoration has become increasingly prioritized in federal and state policies. For example, in Vermont, for the period 2010-2012, 48.2 wetland acres were impacted or destroyed, requiring 323.2 acres mitigated for permits under the US Clean Water Act (Adusumilli, 2015). Restored ecosystem services were valued at about $140,000 per acre mitigated per year in the state of Vermont, totaling almost $2.75 million throughout the United States (Adusumilli, 2015). This calculation takes into account restored water functions – supply, quality, and flood control – as well as recreational and commercial value, but excludes carbon sequestration.
However, created and restored wetlands may not be functionally equivalent to natural wetlands (Junk et al., 2013). After all, one acre of wetland loss in Vermont requires mitigation for almost six times the area (Adusumilli, 2015), incentivizing preservation over restoration. This is especially important for carbon sequestration. The protection of peatlands is the most relevant for carbon sequestration in Vermont. It can take thousands of years to accumulate the organic matter again. It is necessary to maintain original wetlands, while pursuing restoration and enhancement for areas that have been lost and degraded, especially for areas that provide the most services.
Box 3.2 – Quantifying Flood Mitigation Services: The economic value of Otter Creek wetlands and floodplains to Middlebury VT
Watson et al., 2016
Amidst all the ecosystem services offered by functional floodplains and wetlands, they are some of the most powerful mitigation tools there are to reduce flood risk in the face of a changing climate. The Otter Creek case study is a valuable example. Otter Creek runs north through a large wetland complex and wide floodplain from Rutland to Middlebury, Vermont. In 2011, Tropical Storm Irene devastated areas across the state. Rutland experienced its highest peak flow on record on August 28th, suffering extensive damages and flooding for the following five days. Downstream, Middlebury had a much lower peak and minor flooding (Figure 3-10).
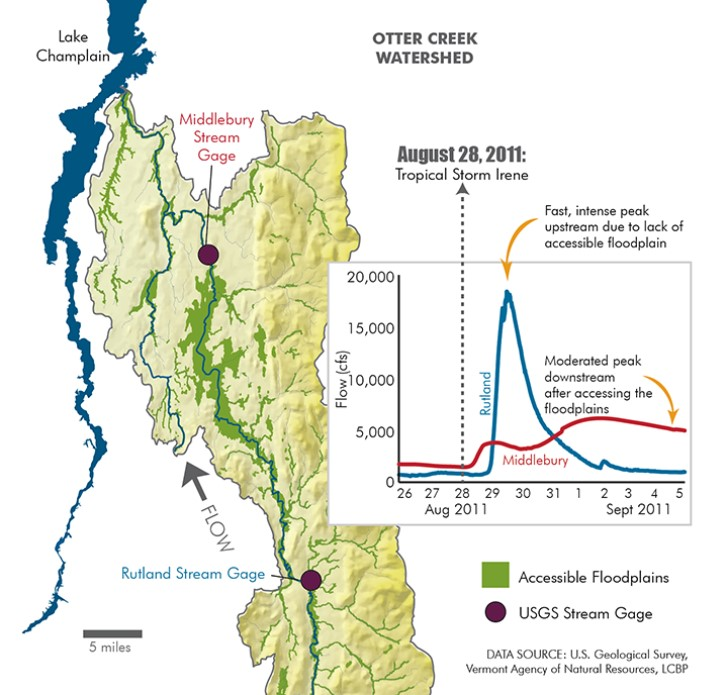
Why? Unlike many of Vermont’s rivers and streams, Otter Creek is not disconnected from its floodplain. The Otter Creek watershed is primarily (60%) forested and accesses 18,000 acres of wetlands. (See Water Features and Ecological Services for background information) During Tropical Storm Irene, the floodplains and wetlands stored then gradually released the floodwater over the course of weeks rather than days. The authors of this study investigated this phenomenon further and attempt to answer two main questions:
1) What was the value of the Otter Creek wetlands and floodplains in reducing flood damage during Tropical Storm Irene in 2011?
2) Beyond this single event, what is the expected annual value of the wetlands and floodplains in mitigating flood damages?
Placing economic value on natural services can be difficult, and this study relied on hydraulic modeling and differing scenarios to achieve this. Researchers modeled two “no wetland” scenarios, which project outcomes if the wetlands and floodplains were partially or not at all contributing to mitigation (no wetlands low, no wetlands high, respectively). They compared them with the actual wetlands to determine the extent of flooding and related damages that were avoided from Tropical Storm Irene in Middlebury (see Table 3-2) Damage estimates are quite conservative because they focus on buildings that would have flooded, using property records, but omit other expenses like road damage or crop loss.
| Comparative summary of peak flows, flood height above the gauge, flooded structures, and expected damages following Tropical Storm Irene. | ||||
|---|---|---|---|---|
| Scenario | Peak discharge (cfs) | Flood height (feet above gauge) | Structures affected | Expected Damages |
| Wetlands | 6180 | 7.4 | 9 | $100,600 |
| No-wetlands low estimate | 15,600 | 12.8 | 21 | $626,600 |
| No-wetlands high estimate | 27,100 | 17.9 | 54 | $1,900,800 |
Modeling procedures were repeated for nine more historical flooding events to evaluate the benefits beyond Tropical Storm Irene. Researchers valued the flood mitigation services of Otter Creek at over $12 million dollars, accounting for over a quarter of conservation costs (equivalent to purchasing the full 18,000 acres of wetlands for conservation). The value of flood mitigation services offered by wetland and floodplains are likely to increase with climate change, as intense precipitation events are already becoming more common.
3.6.3 Social Vulnerability, Flooding and Disaster Risk Reduction
Ned Swanberg
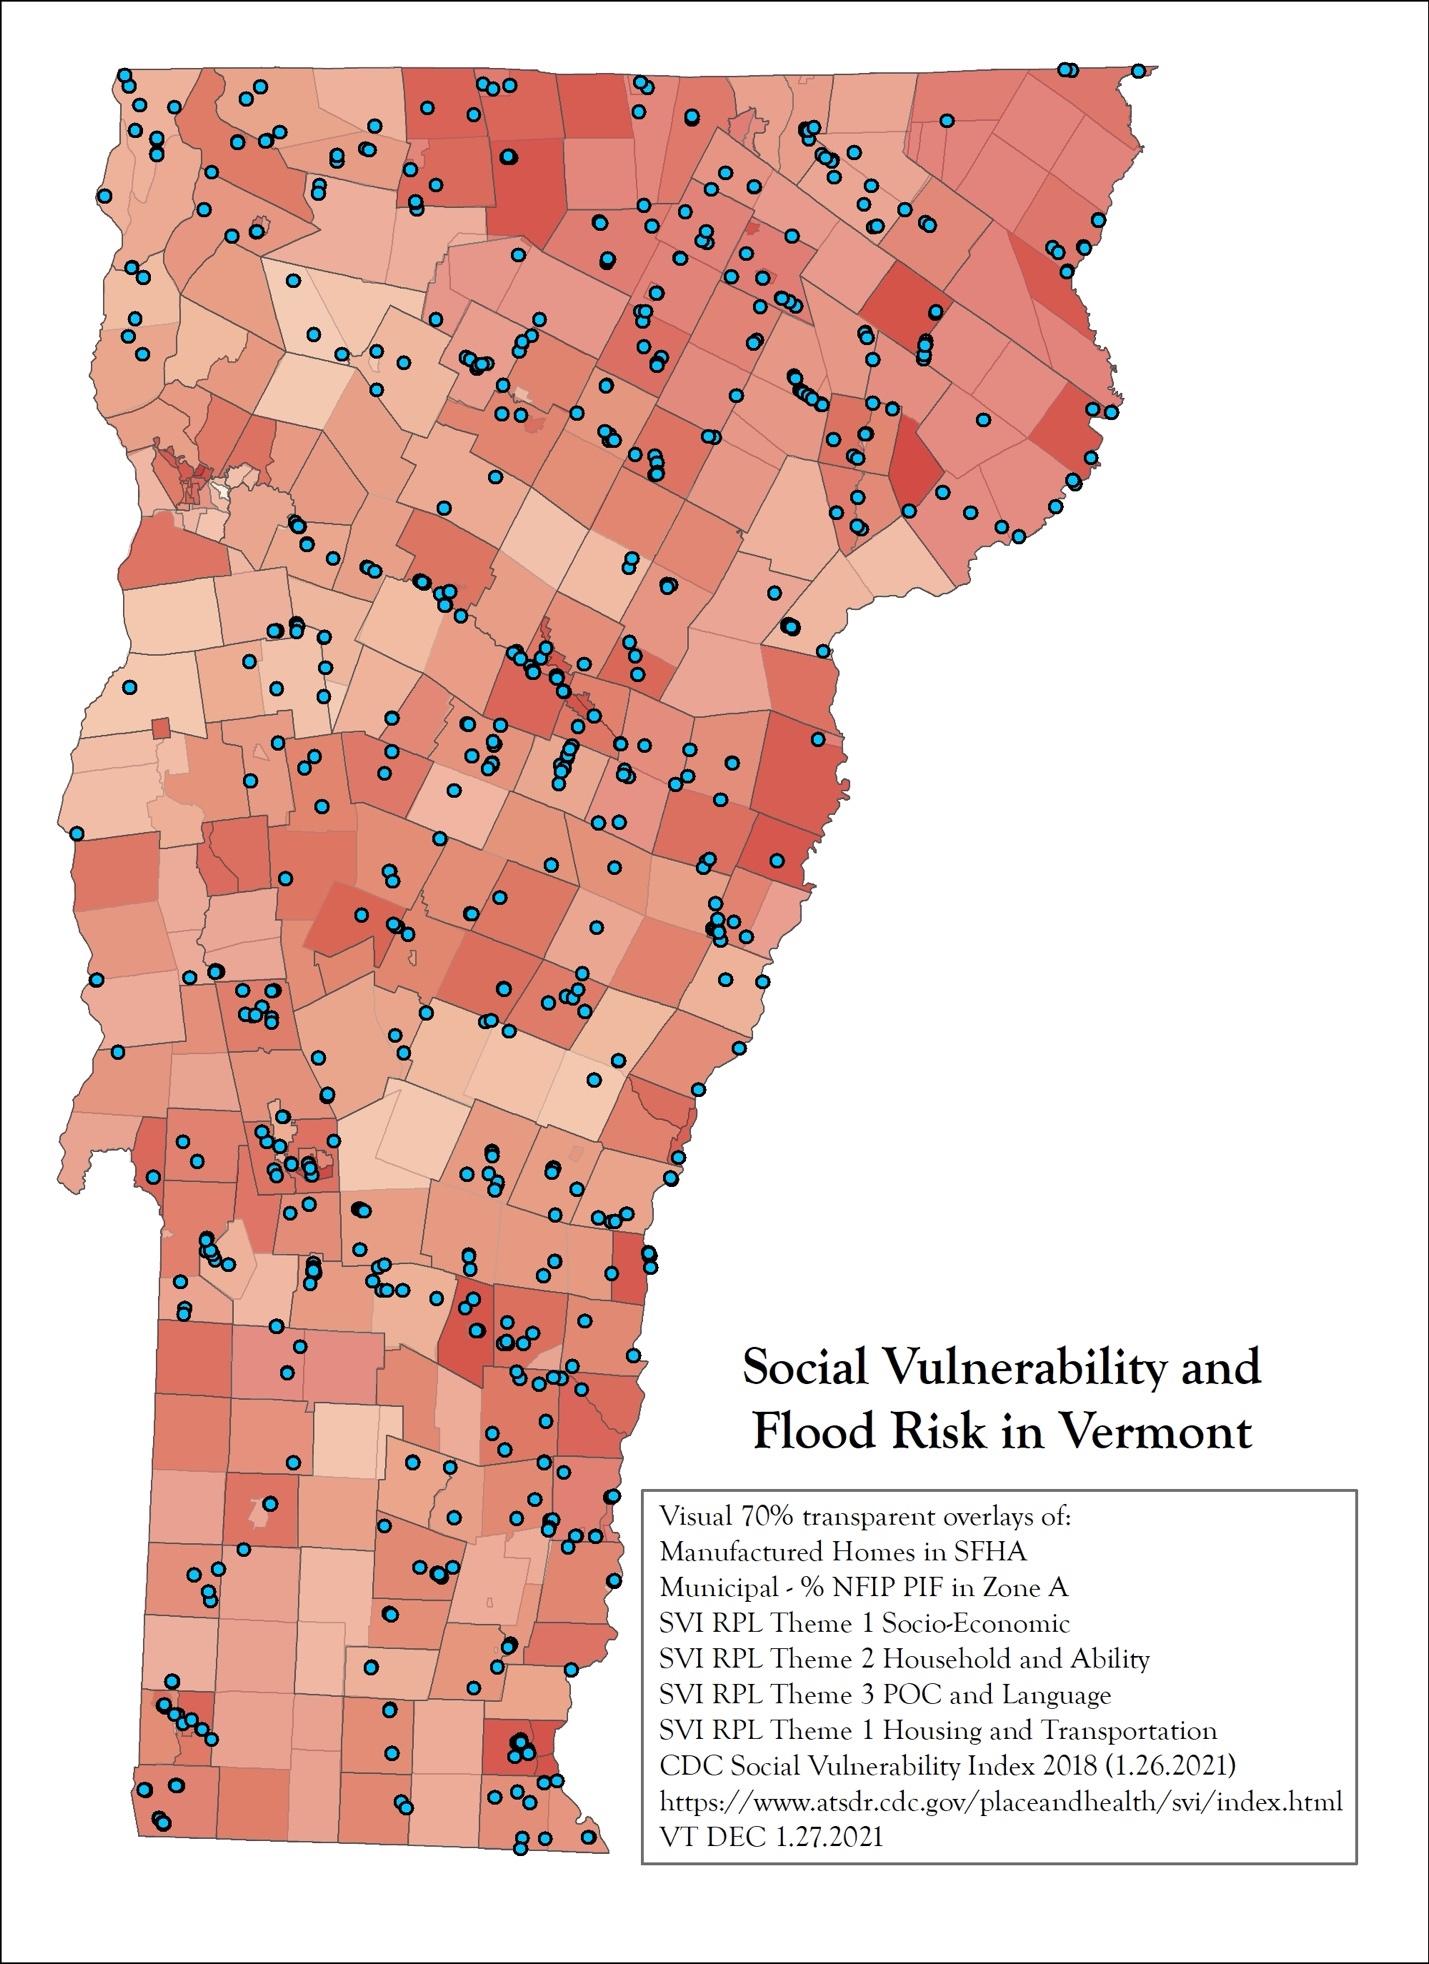
Key Point: Development in flood hazard areas endangers those structures and the citizens that use them. This risk is unequally distributed within Vermont spatially, and skews toward socially vulnerable groups.
In Vermont over ten thousand structures are located within a high-risk Special Flood Hazard Area (SFHA) (State of Vermont, 2021). These flood risk areas, as mapped for the National Flood Insurance Program (NFIP), indicate areas with a one percent annual chance of flooding. Over the period of a thirty-year mortgage this represents more than a 1 in 4 chance of experiencing flooding at the site. Within the area are portions that experience more frequent flooding. Less frequent and larger floods will also occur and reach beyond the mapped boundaries.
Most of the damage due to flooding in Vermont is not well characterized by these data. The actual damage in Vermont is often due to the erosive power of moving water, not so much by saturation. Hence, a considerable amount of work is underway in Vermont to protect river corridors both to avoid direct damage from erosion as well as to accommodate the room needed by the channel to avoid incision, maintain functional floodplains, and to diminish and delay flood peaks.
Special Flood Hazard Areas in Vermont were first mapped in the 1970s and became the basis for municipal regulation and participation in the National Flood Insurance Program (www.msc.fema.gov). The most recent map update was in Bennington County (effective 12/2015) and portions of other counties with Digital Flood Insurance Rate Maps received updated detailed studies. Notably, none of these recent maps reflect the Vermont flood discharges of 2011. All these mapped areas include some areas with detailed engineered studies and other areas with approximate studies. Currently FEMA is undertaking flood hazard map updates in many Vermont watersheds. If funded, these maps may become generally effective around 2025.
Under FEMA mapping guidelines, the maps show the flood levels based on past flood discharges. Since the 1970s precipitation has increased, and precipitation patterns have been altered. At their best, the boundaries of the mapped Special Flood Hazard Areas portray the past and do not adequately represent the current or future conditions and risks associated with inundation.
The flood risk in the maps and data below reflect best available data from both officially digitized together with rough non-official digital maps of effective Special Flood Hazard Areas and e-911 site location data in Vermont. While these data have considerable error-bands they do allow us to broadly examine the distribution and character of flood risk in Vermont.
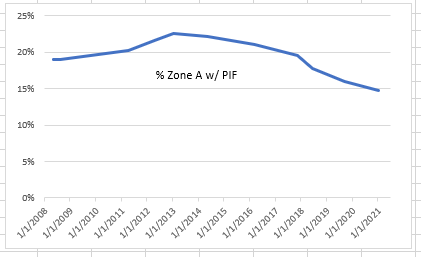
In Vermont, approximately 4% of all structures are within a high-risk Special Flood Hazard Area. This varies by community and can be viewed in expanded community reports. Also, very few structures within the SFHA are carrying any level of flood insurance. This level has declined to 15% after reaching a peak of nearly 25% in 2013. This decline in flood insurance uptake may reflect several factors: flood amnesia, people dropping insurance when it is not specifically required by a lender, and the rising cost of flood insurance premiums and fees. Several private insurance companies have recently begun to offer flood insurance in Vermont. In October 2021 FEMA rolled out a fundamentally new method of calculating flood insurance premiums as Risk Rating 2.0. These changes may significantly change flood insurance uptake, household resilience and community flood recovery.
Concentrations of Risk
Of the roughly 12,000 structures located in the SFHA, the communities with the highest concentrations include the Town of Bennington, Barre City, Brattleboro, and Montpelier. Some of the concentrations reflect lake shore development and approximate mapping.
| Town | Structures in the SFHA |
|---|---|
| Bennington | 476 |
| Barre City | 342 |
| Brattleboro | 325 |
| Montpelier | 312 |
| Saint Albans Town | 283 |
| Morgan | 264 |
| Windsor | 249 |
| Alburgh | 203 |
| Ludlow | 190 |
| Woodstock | 190 |
| Derby | 181 |
| Waterbury | 175 |
| Swanton | 172 |
| Pownal | 168 |
| North Hero | 162 |
| Berlin | 161 |
| Ferrisburgh | 141 |
| Barnet | 137 |
| Rutland City | 135 |
| Lunenburg | 131 |
| Johnson | 126 |
| Jamaica | 120 |
| Lyndon | 117 |
| Wells | 114 |
| Dover | 108 |
| Northfield | 108 |
| Saint Johnsbury | 107 |
| Richmond | 100 |
| Wilmington | 100 |
Structures at Risk and Social Vulnerability
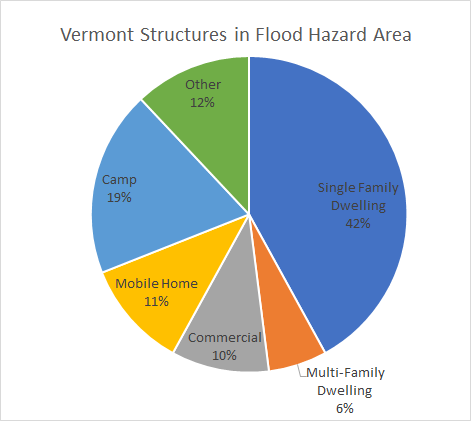
Among the structures most vulnerable to direct damage from flooding are structures with below grade basements (common in Vermont), single story structures, and manufactured homes. The presence of a basement, or the number of building stories is difficult to determine from remote sensing data. Manufactured Homes (or Mobile Homes) represent over 10% of the structures in the high-risk flood hazard area (Baker et al., 2014). Manufactured homes are particularly susceptible to damage from inundation. Additionally, since manufactured homes are also low-cost structures, they easily can experience total loss or “Substantial Damage” from inundation: where repair costs exceed 50% of the value of the structure.
Social vulnerability is defined as “the potential negative effects on communities caused by external stresses on human health”, which includes natural or human-caused disasters and disease outbreaks (CDC/ATSDR, 2021). “Reducing social vulnerability can decrease both human suffering and economic loss” (CDC/ATSDR, 2021). Spatial analysis has found national hotspots where flood exposure and social vulnerability combine, with three characteristics that are significant in these hotspots: manufactured homes, and Black or Native American populations (Tate et al., 2021). The Centers for Disease Control and Prevention (CDC) have published a Social Vulnerability Index compiling US Census block data around four themes (socio-economic, household, race/ language, and housing type) using 15 census variables (CDC/ATSDR, 2021).
The choropleth map in Figure 3-13 shows the four CDC themes as transparent overlays. These four themes (Table 3-4) are prominent in the northeastern portion of Vermont and other municipalities.
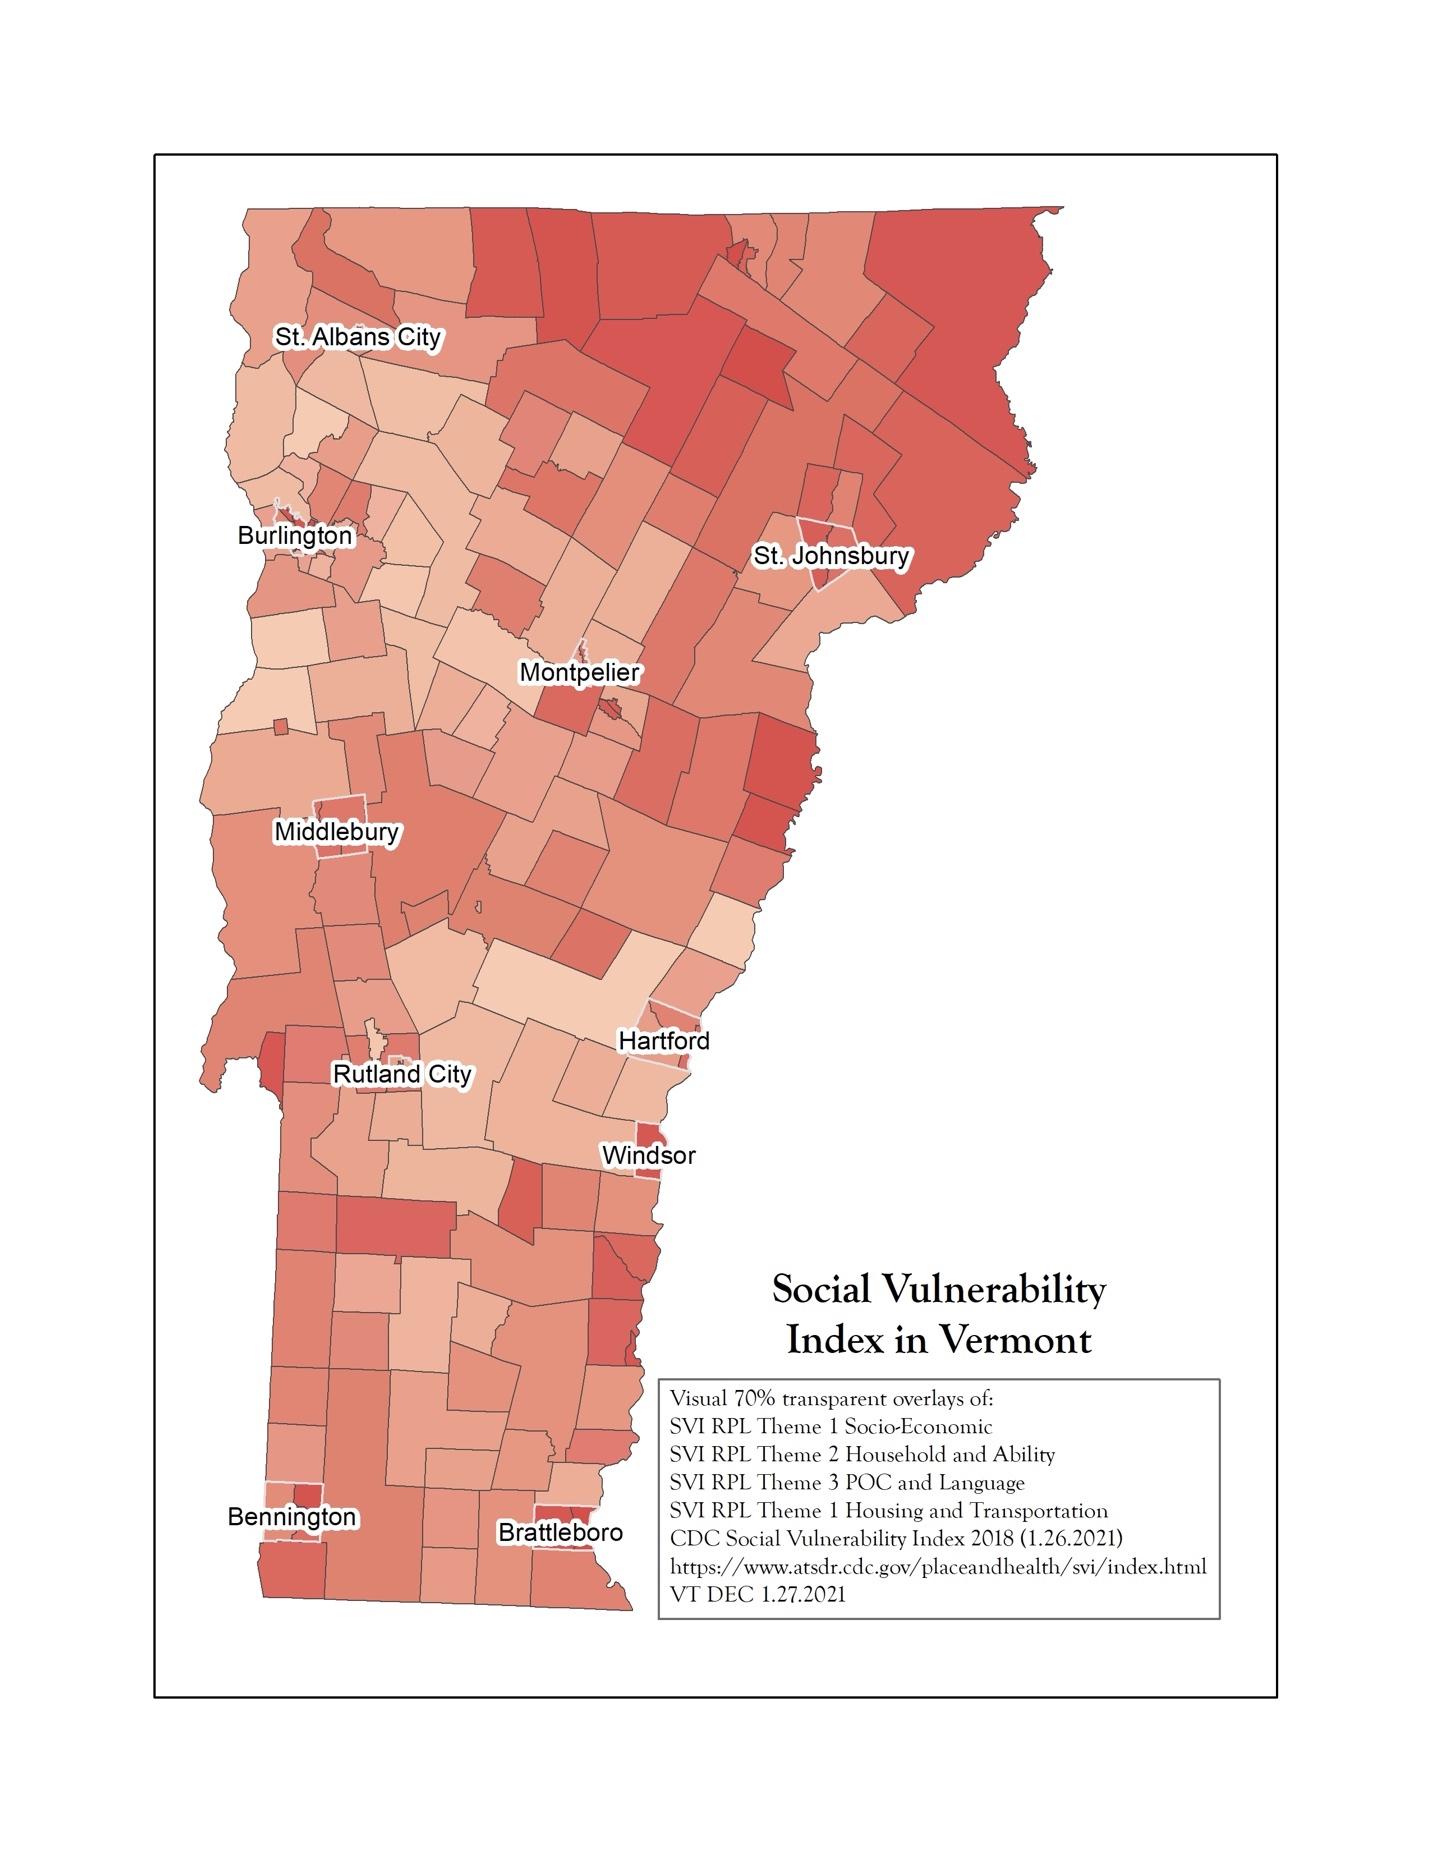
| CDC Social Vulnerability Themes | Social Factors |
|---|---|
| Socioeconomic status | below poverty, unemployed, income, no high school diploma |
| Household composition and disability | aged 65 or older, aged 17 or younger, older than 5 with a disability, single-parent households |
| Minority status and language | minority, speak English “less than well” |
| Housing type and transportation | multi-unit structures, mobile homes, crowding, no vehicle, group quarters |
Figure 3-14 includes an additional transparent municipal layer indicating the percentage of structures in the flood zone without flood insurance, and the locations of manufactured homes in the flood zone.
In 2020 FEMA began a process of looking at social equity in its hazard mitigation programs such as Building Resilient Infrastructure and Communities (BRIC); the successor to the Pre-Disaster Mitigation Grant Program. At this time there is a need for access to safe affordable housing in Vermont including socially vulnerable people living in high-risk flood hazard areas.
Box 3.3 Spatial targeting of floodplain restoration to equitably mitigate flood risk
Gourevitch et al., 2020
Floodplain restoration enhances communities’ resilience to flooding and climate change. It can be difficult to determine where to implement it, and budgets are limited, so localized flooding data at fine spatial scales supports targeted decision-making. A second challenge is incorporating social vulnerability to ensure equitably distributed benefits from restoration projects and risk of flood exposure.
Lewis Creek is a small watershed in eastern Vermont that is vulnerable to flooding due to mountains upstream. 41 properties are located in the SFHA, many of which are manufactured or mobile homes. Flood damages were estimated based on hydraulic modeling for 1%, 4%, 10%, and 50% annual chance flood intervals. They are heavily skewed towards lower-income properties, with the bottom quartile incurring >90% of damages and 25 mobile homes incurring damages 5x their appraised value. A range of restoration scenarios were identified to account for varying budgets.
199 potential restoration sites were identified, but benefits could be maximized by revegetation of wetlands or floodplains in only a few of them. This demonstrates the benefits of spatially-targeted data in terms of ecosystem services. However, the distribution of avoided damages tended to favor more expensive buildings/ higher-income property owners, and giving more weight to equity in choosing restoration projects does not highly change the outcome for this case study. The authors suggest that this may not be the same everywhere, and compensatory mechanisms should be in place so lower-income property owners can be compensated for damages and value of avoided damages. Overall, this case study is an excellent example of the inequitable weight of flood exposure in Vermont communities.
3.6.4 Stream-Crossing Infrastructure
Key Point: Stream-crossing infrastructure suffers extensive damage due to flooding. Bridges and culverts are vulnerable to failure during high-flow conditions, especially when outdated or undersized.
Road-stream crossing infrastructure is some of the most vulnerable to flooding damage because these structures intersect the river corridor. Depending upon the structure design, stream crossings and their road approaches can impound floodwaters, constrict flows, and induce debris jams.
During Tropical Storm Irene in 2011, about 480 bridges and 960 culverts were damaged, in addition to >2500 miles of road (VT Emergency Management, 2018). Since then, the State of Vermont has modified stream crossing standards for culverts and bridges to accommodate the bank-full discharge and consider the geomorphic condition of the reach. Statewide assessments of crossing structure dimensions and conditions has led to systematic and ongoing efforts to bring vulnerable structures into a compatible condition.
Small under-the-road culverts (away from streams) are also vulnerable to damage from high flows including localized thunderstorms. Undersized and clogged culverts can lead to considerable road damage. Many Vermont roads were located in immediate proximity to streams and rivers following historical patterns including those of early lumber operations that straightened steep mountain brooks (Kline & Cahoon, 2010). This legacy pattern leaves hilly Vermont particularly exposed to considerable damage at crossing structures, roads, and nearby buildings from all sizes of high flows and flash floods.
Some sites are simply poorly located to host a stream crossing (Bates & Kirn, 2009; Gillespie et al., 2014). Planners should determine the necessity of a structure when planning to build or replace it; critical structures include those with high-volume traffic or emergency service routes (Austin & McKinley, n.d.). For more information on criticality and flood vulnerability in the state transportation network, see VTrans Statewide Highway Flood Vulnerability and Risk Map in Resources.
3.6.5 Flood Risk for Structures
Keeping in mind how critical a structure is, there are further issues considering heightened risk of flood exposure: outdated structures, undersized structures, and resilient engineering standards.
Outdated Infrastructure
Outdated stream-crossing infrastructure is common in Vermont and throughout New England. Over 20% of Vermont’s bridges are functionally obsolete and do not meet current engineering standards. With increases in precipitation, high flows, and severe storm events due to climate change, these outdated features are vulnerable to failure. Many bridges and culverts have reached the end of their useful life, and are not built to modern higher-resilience standards. With limited funding, they can exceed their intended lifespan by decades, while incurring repetitive costs for maintenance, operations, and repairs (American Society of Civil Engineers Vermont Section, 2019). While the oldest structures are not necessarily the ones that need immediate repair or replacement, this analysis stays relevant for incoming decades as Vermont evaluates how to build flood mitigation features into its transportation network.
Many of Vermont’s bridges were built from the 1930s to 1970s; they were designed for a useful life of 50 years (American Society of Civil Engineers Vermont Section, 2019). A culvert’s useful life is more variable depending on building material and environmental factors, from 25 to over 100 years. A typical steel culvert using the traditional hydraulic design approach tends to last 25-50 years (Gillespie et al., 2014). In New York State, for example, the average useful life of a culvert is 56 years (Molinas & Mommandi, 2009).
Current inspection information for bridges and culverts was used to produce Figures 3-15 and 3-16. This inventory is maintained by the Vermont Department of Transportation, but does not always stay up to date or include every municipality. The year built is divided into equal intervals based on the useful life of the structure (i.e. a structure built before 1970 with a useful life of 50 years has reached the end of it by 2020). If the structure was replaced, the year of reconstruction was used to accurately reflect the age of the structure. Short structures (6-20 feet in length) are primarily culverts, while long structures (>20 feet) tend to be bridges. There are bridges and culverts in both datasets, which are available from the VT Open GeoData portal.
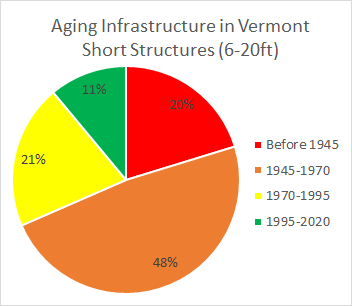
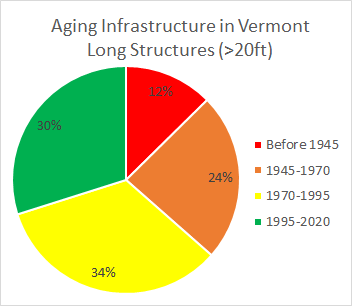
Figure 3-15: Pie charts of age breakdown for short structures (left) and long structures (right) throughout the state of Vermont.
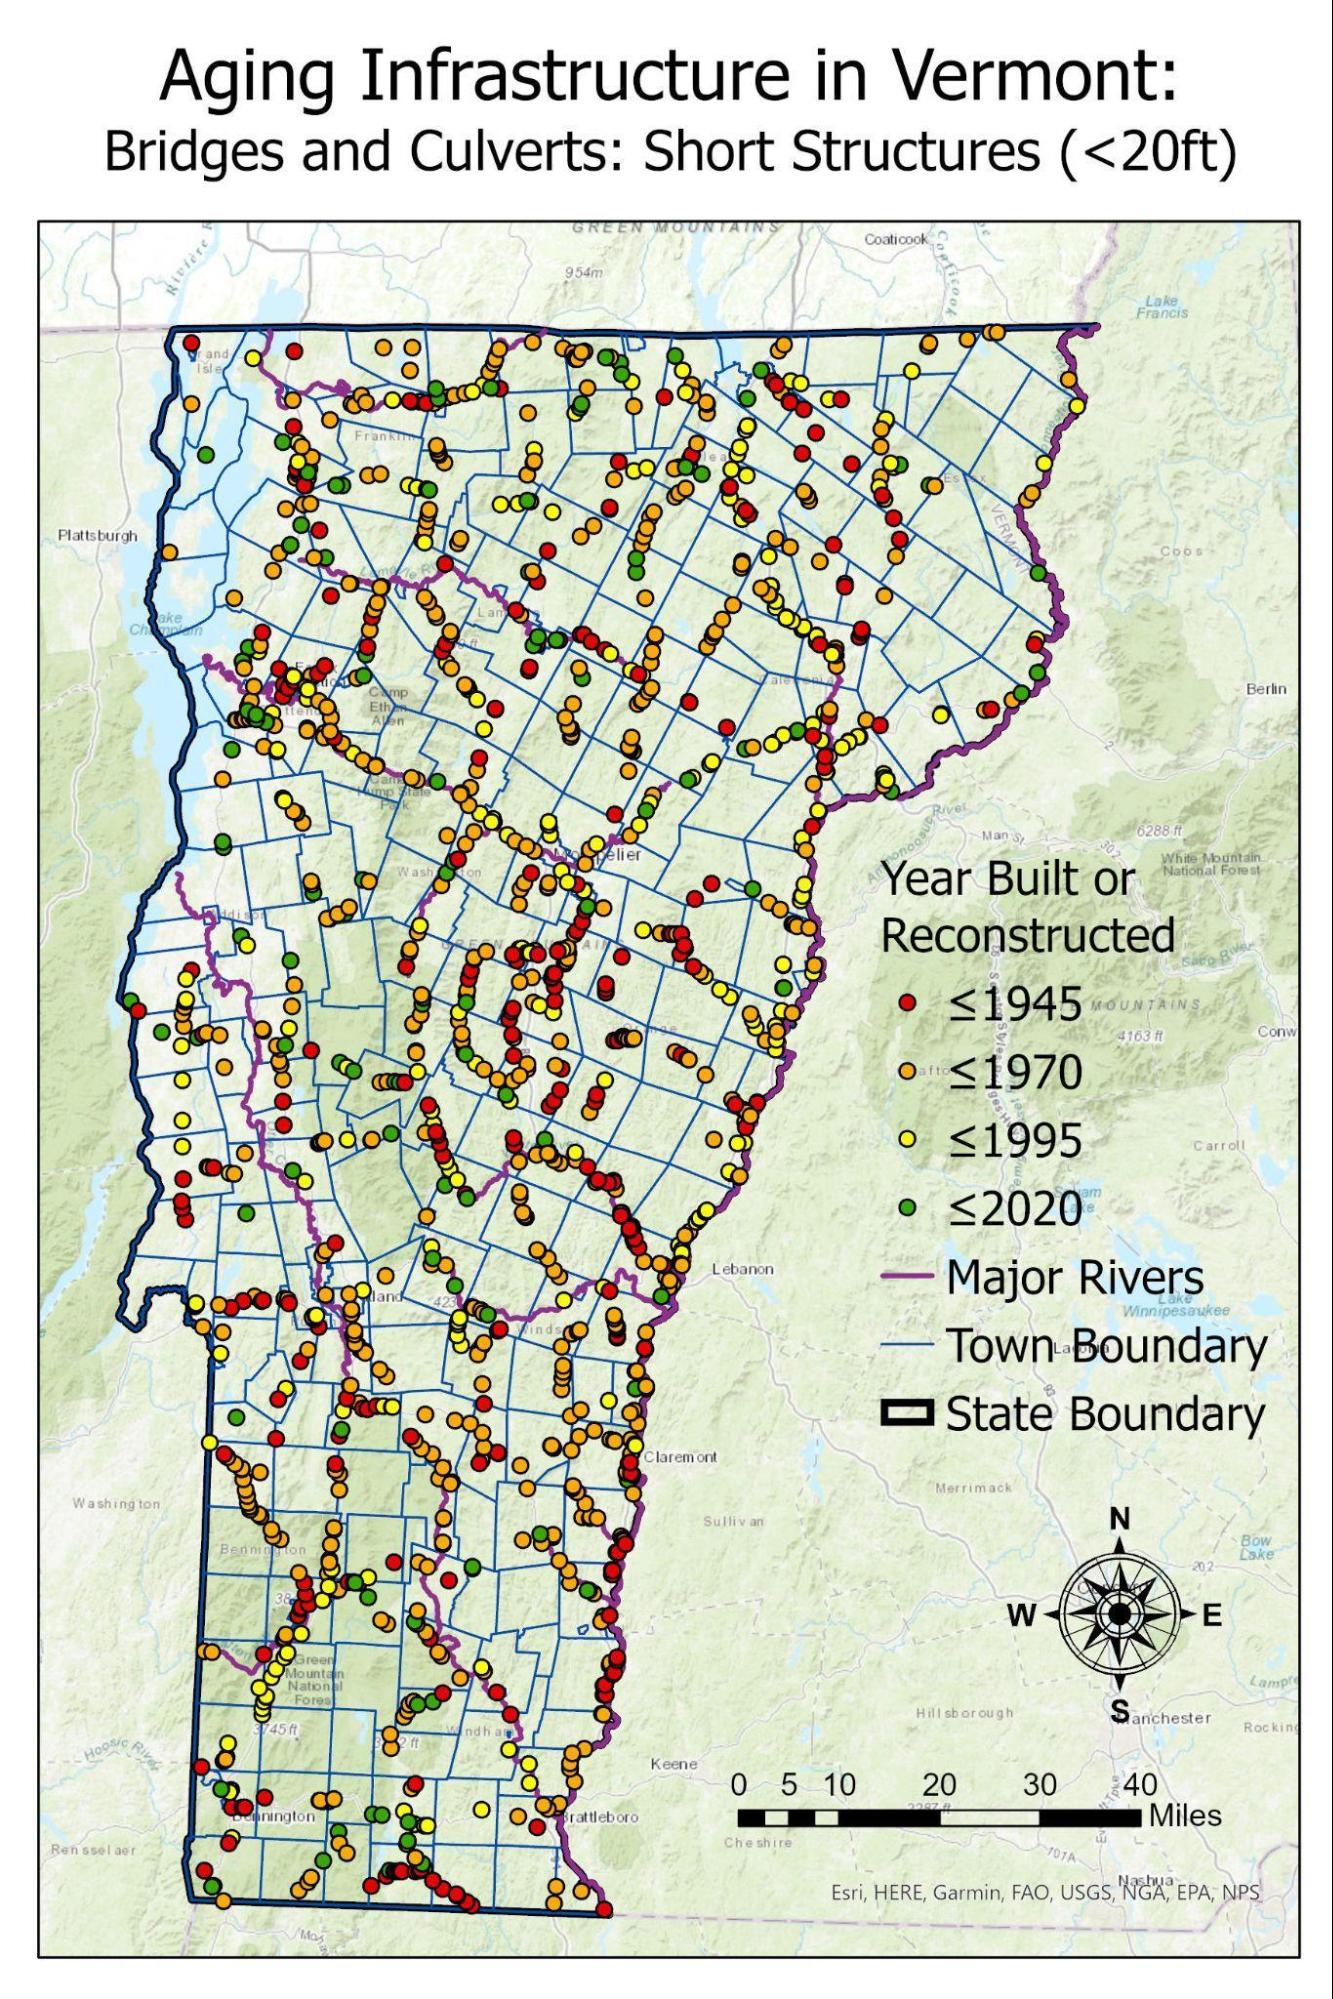
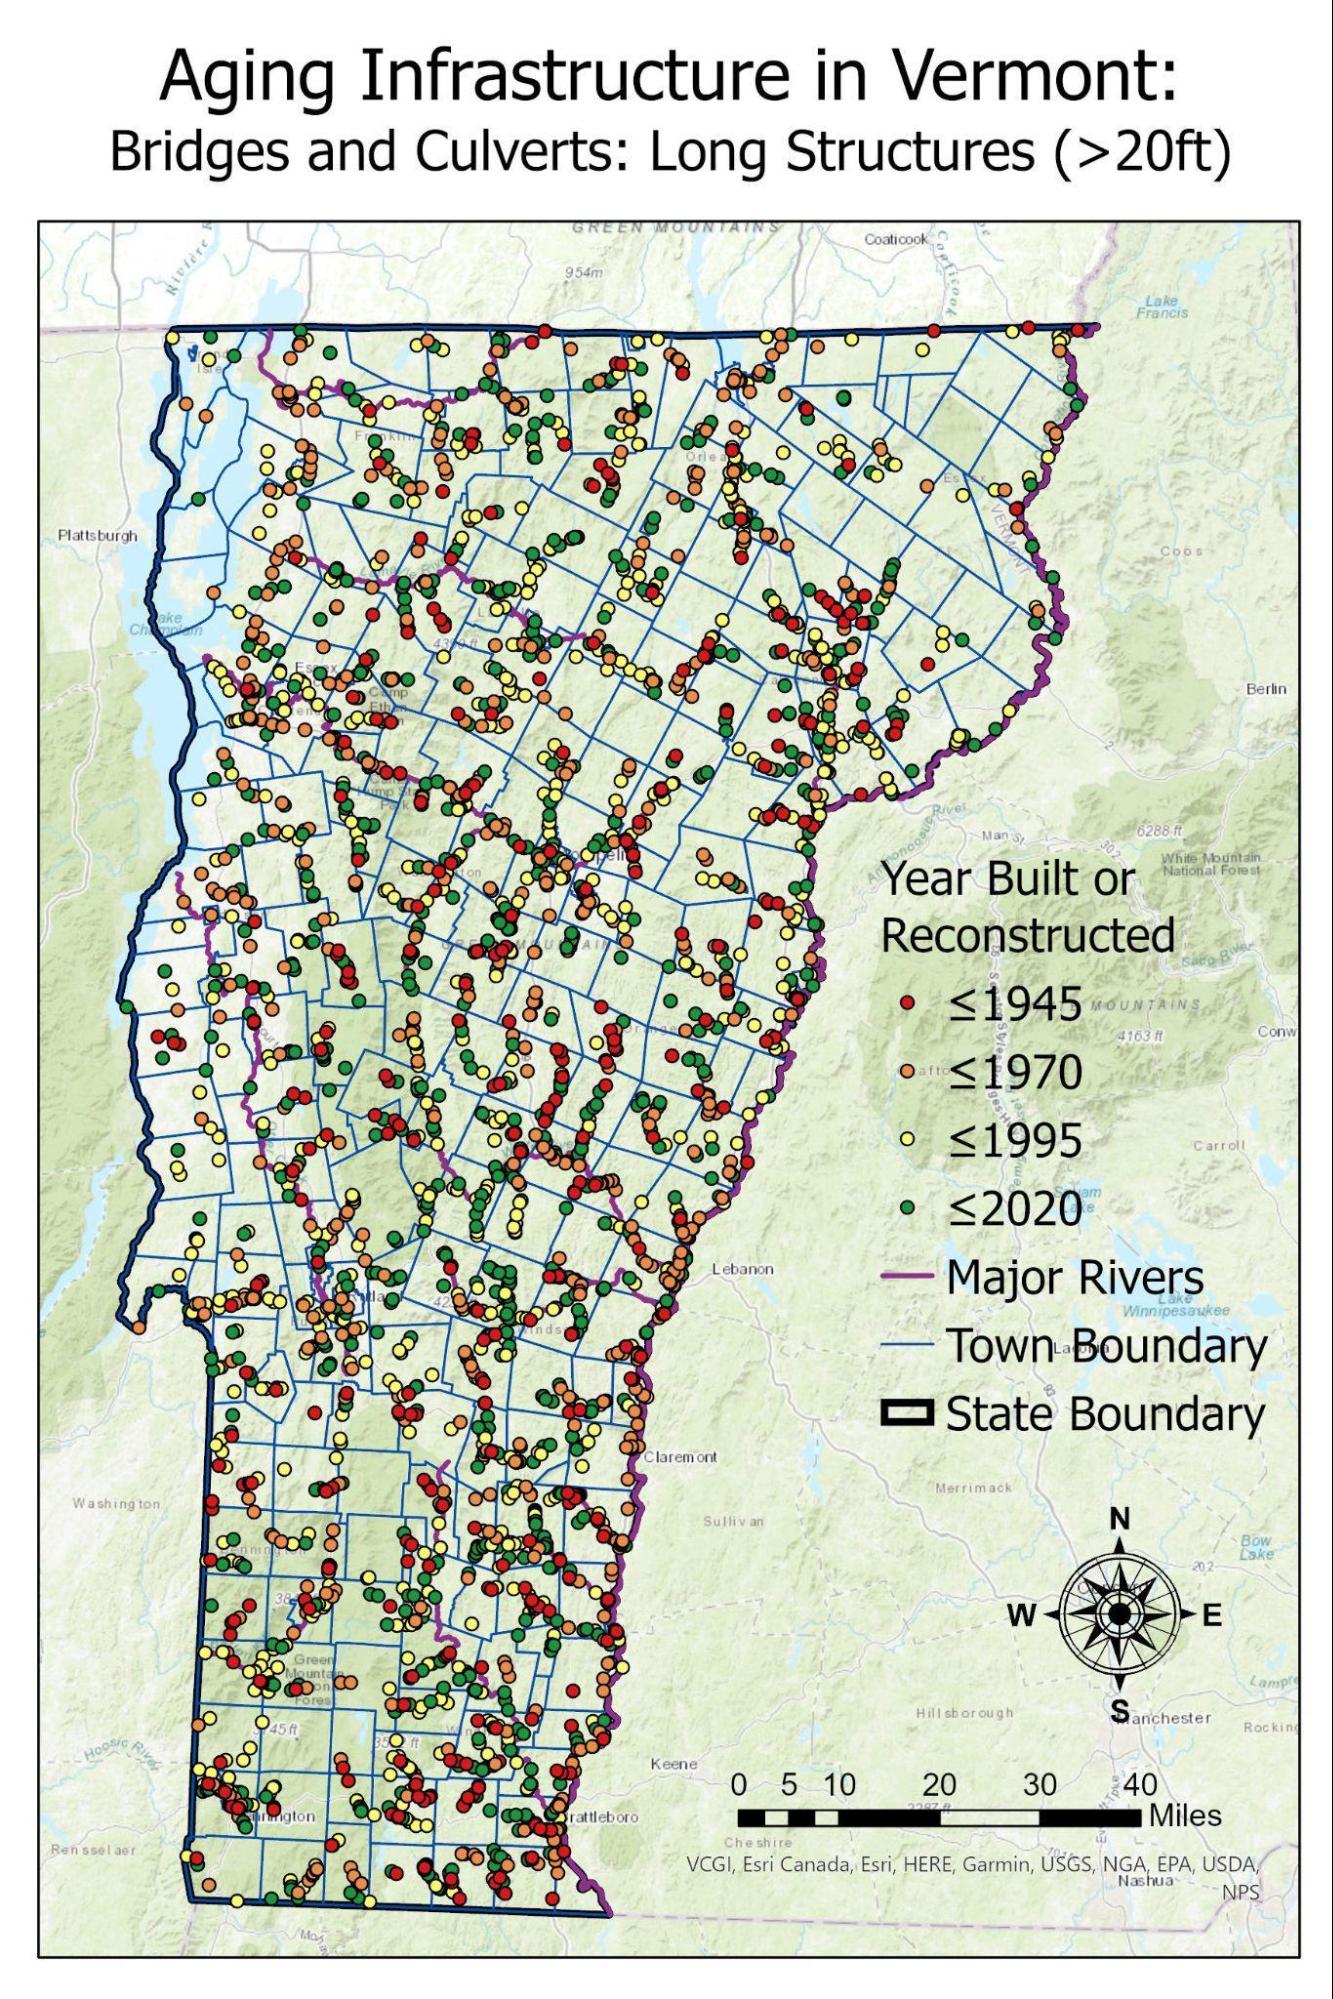
Figure 3-16: Spatial distribution of bridges and culverts in Vermont. Many stream-crossing structures (points) follow major river stems (purple line).
These figures emphasize the outdated and vulnerable nature of Vermont’s current infrastructure network. On the assumption that the useful life of these structures is about 50 years (American Society of Civil Engineers Vermont Section, 2019; Gillespie et al., 2014), that means that 68% of short structures and 36% of long structures in Vermont are past due for replacement (orange and red categories).
Undersized Infrastructure
Culverts and bridges are undersized when they do not appropriately fit the size of the channel, hindering their ability to manage streamflow, pass debris, and allow fish passage. High-magnitude precipitation events are becoming more common in Vermont (Guilbert et al., 2015), and undersized culverts exaggerate the impacts. Water is channeled through an outlet that is too small, creating powerful flows. During storm events, undersized culverts can fail when floodwaters exceed the hydraulic capacity of the culvert, or debris and/or sediments plug up the culvert (Gillespie et al., 2014).
Many undersized culverts result from traditional hydraulic capacity design, made to handle a certain flood, like with an annual 1%, 2%, or 4% chance of occurrence. Discharge estimates used in these designs have standard error estimates over 40%. They are also based on historic data and do not incorporate the increasing precipitation trends observed in the Northeast nor climate change projections (Gillespie et al., 2014). By defining the structure’s design in this way, channel size is disregarded, resulting in undersized culverts that are vulnerable to failure. When a stream-crossing structure failed, it was usually replaced in-kind, or with a structure that has the exact same design, until recently, when the damage incurred during Tropical Storm Irene forced changes in engineering standards. Replacement costs after failure are supplemented by damages to nearby property and roads and can be incurred multiple times in the culvert’s lifetime (Gillespie et al., 2014). With many undersized culverts remaining throughout Vermont, they are left vulnerable to high flows, heavy storms, and extreme events. As heavy precipitation increases in Vermont, alternatives need to be adopted that can endure future conditions.
Engineering Alternatives and Solutions
Stream simulation design is an ecologically-based engineering alternative that has gained ground in recent years in Vermont (Bates & Kirn, 2009). It aims to simulate, as closely as possible, the characteristics and dimensions of the natural channel, acting as a solution to undersized structures while improving wildlife passability and ecological connectivity (Gillespie et al., 2014).
The benefits of the stream simulation design approach go beyond aquatic organism passage and stream connectivity (Austin & McKinley, n.d.; Bates & Kirn, 2009; Gillespie et al., 2014; Christiansen et al., 2014). The size of the culvert must match or exceed that of the channel, so that floodwaters and debris can pass through more easily, reducing risk of failure from flooding and erosion. Culverts built by stream-simulation design can achieve lifetimes double that of traditional hydraulic capacity design; ranging from 50-75 years rather than just 25-50 years (Christiansen et al., 2014). The Vermont Department of Fish and Wildlife has proposed incorporating stream simulation design concepts into Vermont’s statewide infrastructure system and construction standards (Kirn, 2016).
Replacing outdated and undersized infrastructure seems a costly problem, but it is also a valuable investment and opportunity. It is inefficient to replace and repair infrastructure with the same designs that cannot withstand flooding failure or offer resilience to climate change, especially since they can fail multiple times within a lifespan. Rather, there is an opportunity to assess when and where these structures are necessary and incorporate projections and resilience into plans to replace them. Anthropogenic climate change has invalidated the historical data and assumptions that form the foundation of their design. Alternatives like stream simulation design offer longevity, economic return on investment, and wildlife suitability. Taking a proactive approach may be key to avoiding the sort of catastrophic outcomes of Tropical Storm Irene.
See Green Mountain National Forest case study as an example of engineering alternatives (Forest Chapter, section 2.5.5).
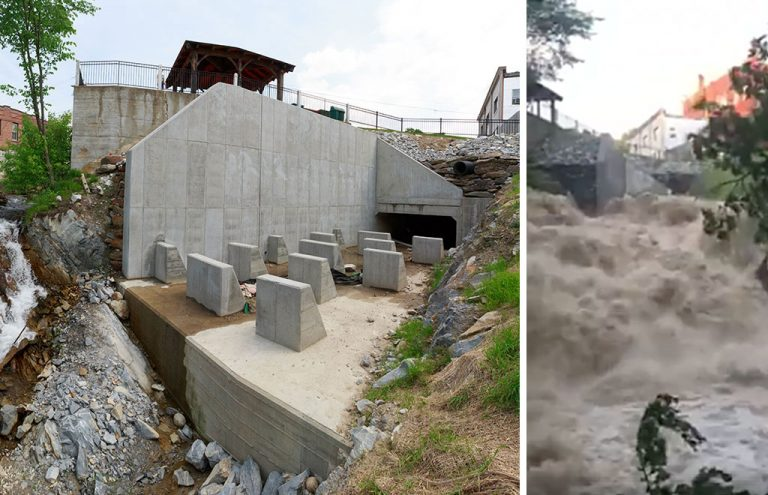
Box 3.4 Local Success in Brandon, Vermont
In 2011, Tropical Storm Irene flooded downtown Brandon in Addison County, Vermont, due to the overtopping of the Neshobe River that is constricted as it runs through the town. Many buildings were damaged, and one was completely destroyed. Brandon incurred an estimated $800,000 in August, 2011 (Brandon, VT Community Report, 2015). Municipal stakeholders reacted quickly, realizing the need for more resilient infrastructure to protect the town from future devastation.
FEMA’s State Hazard Mitigation Program allocated $2.55 million to design and construct an overflow culvert to divert excess water from the Neshobe away from downtown property. Construction was completed in May 2017, and on July 1st, just forty days later, a major storm hit Addison County. Downtown Brandon experienced no flood damages — a successful return on investment (DuBois & King, Inc., 2017).
3.7 Resources for Community Members and Planners
These are Vermont resources for interested parties to find hyper-local information. Many of these resources allow one to search by address or municipality to get specific information that is most relevant to them. These resources do not always have complete data coverage or are not always up to date. However, these resources allow a user to apply the kinds of information presented in the VCA 2021 at fine spatial scales.
3.7.1 Building in the Floodplain
National Flood Insurance Program, Floodplain Management Requirements. Accessed online 21 May 2021 at https://www.fema.gov/pdf/floodplain/nfip_sg_unit_5.pdf
State of Vermont, Flood Training Protection Tools, Build it Safe. Accessed online 31 May 2021 at https://floodtraining.vermont.gov/protection-tools/build-safe
State of Vermont, Vermont Flood Hazard Area and River Coordinator Rule. Access online 31 May 2021 at https://dec.vermont.gov/sites/dec/files/documents/wsmd-fha-and-rc-rule-adopted-2014-10-24.pdf
3.7.2 Flood Vulnerability
State of Vermont, Flood Ready Atlas (maps.vermont.gov). Accessed online 31 May 2021 at tinyurl.com/floodreadyatlas
- Flood hazard areas (from FEMA)
- Participating communities in insurance programs
U.S. Government, FEMA Flood Maps. Access online 31 May 2021 at https://msc.fema.gov/portal/home
- FEMA maps for localized flood data
- Search by address
- Problem: many flood hazard maps are outdated, and some areas that are mapped outside the flood zone are still at risk (as with Hurricane Irene)
State of Vermont, Flood Ready Vermont Community Reports. Accessed online 31 May 2021 at https://floodready.vermont.gov/assessment/community_reports#Expanded
Use Flood Ready Vermont Community Reports to generate information on your community’s:
- Insurance information and participation in ERAF incentive program
- Number of structures in the flood zone
- Compliance with road and bridge standards
- Compliance with river corridor protections
State of Vermont, Flood Training. Accessed online 31 May 2021 at https://floodtraining.vermont.gov/
This provides in-depth, yet accessible, explanations of key flooding concepts like:
- Floodplains and River Corridors
- Special Flood Hazard Areas
- No Adverse Impact
International Joint Commission, International Lake Champlain-Richelieu River Study Board at https://www.ijc.org/en/lcrr
This is an ongoing project to assess causes, impacts, risks and potential solutions to flooding in the Lake Champlain-Richelieu River Basin.
3.7.4 Wetlands
State of Vermont Agency of Natural Resources:
- Wetlands Inventory. Accessed online 31 May, 2021 at https://anrmaps.vermont.gov/websites/WetlandProjects/default.html
- Wetland Screening Tool. Accessed online 31 May 2021 at https://anrmaps.vermont.gov/websites/wetlandScreening/
- Landowner’s Guide to Wetlands. Accessed online 31 May 2021 at https://dec.vermont.gov/sites/dec/files/wsm/wetlands/docs/wl_Am_I_in_a_Wetland.pdf
- Wetland Restoration. Accessed online 31 May 2021 at https://dec.vermont.gov/watershed/wetlands/protect/restore
3.7.5 Stream Gauge Records
Streamflow records shown in the text were standardized to 1960-present. Here, we include the full observational record for each site. Trends are statistically significant (p<0.05, Mann Kendall) for all sites’ entire period of record (Figure 3-18). P-values are given in Table 3-5 along with USGS site identification numbers and place names.
| USGS Site ID | Site Name | Mann Kendall, p-value (full record) | ||||
|---|---|---|---|---|---|---|
| Annual | Winter | Spring | Summer | Autumn | ||
| 01134500 | MOOSE RIVER AT VICTORY | 0.00195 | 0.00049 | 0.5645 | 0.01794 | 0.003 |
| 01139000 | WELLS RIVER AT WELLS RIVER | 0.00171 | 0.0003 | 0.558 | 0.00194 | 0.00368 |
| 01139800 | EAST ORANGE BRANCH AT EAST ORANGE | 0.02846 | 4.029e-5 | 0.2411 | 0.00113 | 0.01462 |
| 01142500 | AYERS BROOK AT RANDOLPH | 0.00073 | 4.268e-5 | 0.9899 | 0.00037 | 0.00373 |
| 01144000 | WHITE RIVER AT WEST HARTFORD | 0.01832 | 9.131-05 | 0.3412 | 0.00878 | 0.0066 |
| 04287000 | DOG RIVER AT NORTHFIELD FALLS | 0.00521 | 0.00076 | 0.3331 | 0.00013 | 0.00996 |
| 04288000 | MAD RIVER NEAR MORETOWN | 0.00018 | 8.631e-5 | 0.3214 | 0.00033 | 0.00248 |
| 04292000 | LAMOILLE RIVER AT JOHNSON | 0.00064 | 1.633e-5 | 0.4224 | 0.009 | 0.0032 |
| 04293000 | MISSISQUOI RIVER NEAR NORTH TROY | 0.00051 | 0.00011 | 0.9368 | 0.00086 | 0.02534 |
| 04293500 | MISSISQUOI RIVER NEAR EAST BERKSHIRE | 0.00052 | 1.037e-5 | 0.7892 | 0.00372 | 0.00397 |
| 04296000 | BLACK RIVER AT COVENTRY | 0.00601 | 2.48e-5 | 0.5357 | 0.0312 | 0.01557 |
3.8 Traceable Accounts
Traceable accounts describe the confidence level—the degree of certainty in the scientific evidence—for each key message resulting from this chapter. This analysis is based on the U.S. Global Change Research Program guidance in the Fourth National Climate Assessment (USGCRP, 2018).
Confidence Level
- Very High – Strong evidence (established theory, multiple sources, confident results, well-documented and accepted methods, etc.), high consensus
- High – Moderate evidence (several courses, some consistency, methods vary, and/or documentation limited, etc.), medium consensus
- Medium – Suggestive evidence (a few sources, limited consistency, models incomplete, methods emerging, etc.), competing schools of thought
- Low – Inconclusive evidence (limited sources, extrapolations, inconsistent findings, poor documentation and/or methods not tested, etc.), disagreement or lack of opinions among experts
Key Message 1
Due to extreme variation in precipitation with our changing climate, periods of prolonged dry-spells and drought, coupled with higher water usage in snowmaking and agriculture could exacerbate low water availability.
- Confidence level: High
- Finding: Increases in overall and heavy precipitation have been observed. Betts 2017 suggests that dry spells will become more common, but an increasing trend in drought has not been assessed. Increased demand for snowmaking is evident due to decreases in natural snowfall and increased temperatures, and multiple sources concur that irrigation demand will increase as well.
- References: Guilbert et. al, 2014; Guilbert et al., 2015; NCA, 2018; Betts, 2017; Wilson et al., 2018; Schaible & Aillery, 2017; Wolfe et al., 2018
Key Message 2
Increases in overall precipitation and extreme precipitation have caused streamflows to rise since 1960. Climate change will further this pattern, although the overall increase in streamflow comes with disruptions in seasonal flows cycles.
- Confidence level: Very High
- Finding: Increases in precipitation and streamflow are evident in several sources and within the analyses produced by this paper. Spring seasonal streamflow did not exhibit significant change over time, despite increases in overall precipitation, suggesting disruption to seasonal flow cycles.
- References: Hodgkins & Dudley, 2011; Hodgkins, 2010; Dudley et. al 2017
Key Message 3
Increases in heavy precipitation jeopardize water quality in Vermont. Storms produce large runoff events that contribute to erosion and nutrient loading. Combined with warm temperatures, this creates favorable conditions for cyanobacteria blooms.
- Confidence level: High
- Finding: Sediment and nutrient loading undoubtedly cause poor water quality in Vermont. Heavy precipitation events, which are increasing under climate change, contribute more to these processes than smaller events. While increases in cyanobacteria blooms have not been directly observed, there is an established relationship between nutrient enrichment and cyanobacteria.
- References: LCBP, 2015; Stockwell et. al, 2020; Smeltzer et al., 2012
Key Message 4
Increased occurrence of high streamflows increase the risk of flooding that causes damages to many roads and crossing structures. Risk reduction requires addressing outdated and unfit structures.
- Confidence level: Very High
- Finding: Flooding causes damage to structures, stream crossings, and roads, as seen after Tropical Storm Irene. There is concurrence about the increased risk of flooding and the lack of suitability of Vermont’s stream-crossing infrastructure in terms of flooding resilience.
- References: LCBP, 2015; Guilbert et al., 2015; Gillespie et al., 2014
Key Message 5
Nature-based solutions are an effective, low-cost approach to climate change adaptation. River corridor, floodplain, and wetland protection dampen flood impacts and improve water quality along with green infrastructure.
- Confidence level: Very High
- Finding: There are several sources and case studies that demonstrate the effectiveness of river corridors, floodplains, and wetlands in improving climate resilience, particularly through flooding protection and water quality improvement.
- References: Watson et al., 2016; Gourevitch et al., 2020; Lester et al., 2019
3.9 References
Adusumilli, N. (2015). Valuation of Ecosystem Services from Wetlands Mitigation in the United States. Land, 4(1), 182–196. https://doi.org/10.3390/land4010182
American Society of Civil Engineers Vermont Section. (2019). Report Card for Vermont’s Infrastructure. https://infrastructurereportcard.org/vermont/
Anderson, I., Rizzo, D. M., Huston, D. R., & Dewoolkar, M. M. (2017). Stream Power Application for Bridge-Damage Probability Mapping Based on Empirical Evidence from Tropical Storm Irene. Journal of Bridge Engineering, 22(5), 05017001. https://doi.org/10.1061/(asce)be.1943-5592.0001022
Austin, B. C., & McKinley, D. (n.d.). Benefits of Stream Simulation Designed Road-Stream Crossings beyond Aquatic Organism Passage.
Baker, D., Hamshaw, S. D., & Hamshaw, K. A. (2014). Rapid Flood Exposure Assessment of Vermont Mobile Home Parks Following Tropical Storm Irene. Natural Hazards Review, 15(1), 27–37. https://doi.org/10.1061/(ASCE)NH.1527-6996.0000112
Bates, K. K., & Kirn, R. (2009). Guidelines for the Design of Stream/Road Crossings for Passage of Aquatic Organisms in Vermont. https://vtfishandwildlife.com/sites/fishandwildlife/files/documents/Learn%20More/Library/REPORTS%20AND%20DOCUMENTS/AOP/GUIDESLINES%20FOR%20DESIGN.pdf
Betts, A.K. (2017). Climate Change in Vermont. Vermont Climate Change Report for the Governor’s Vermont Climate Action Commission. DOI:10.13140/RG.2.2.30544.81920
Brandon, VT Community Report. (2015). Vermont Economic Resiliency Initiative, p. 90. VT Agency of Commerce & Community Development.
Brattleboro Public Works Department. (n.d.). Water Supply. Brattleboro Vermont. Retrieved June 29, 2021, from https://www.brattleboro.org/index.asp?SEC=11941994-4574-4A69-AAA6-11CE2C045D00&Type=B_BASIC
Brooks, R. T. (2009). Potential impacts of global climate change on the hydrology and ecology of ephemeral freshwater systems of the forests of the northeastern United States. https://doi.org/10.1007/S10584-008-9531-9
Carr, E. W., Shirazi, Y., Parsons, G., Hoagland, P., & Sommerfield, C. K. (n.d.). Modeling the Economic Value of Carbon Sequestration by Wetlands in the Delaware Estuary: Historic Estimates and Future Projections.
CDC/ATSDR. (2021). Centers for Disease Control and Prevention (CDC) and Agency for Toxic Substances and Disease Registry (ATSDR). Social Vulnerability Index. https://www.atsdr.cdc.gov/placeandhealth/svi/index.html
Christiansen, C., Filer, A., Landi, M., O’Shaughnessy, E., Palmer, M., & Schwartz, T. (2014). Cost-benefit analysis of stream-simulation culverts. http://www.lafollette.wisc.edu/images/publications/cba/2014-culvert.pdf
Dahl, T.E. (1990). Wetlands losses in the United States 1780’s to 1980’s (p. 13). U.S. Department of Interior, Fish and Wildlife Service.
Dawson, J., & Scott, D. (2007). Climate Change Vulnerability of the Vermont Ski Tourism Industry. Annals of Leisure Research, 10, 550–572. https://doi.org/10.1080/11745398.2007.9686781
DuBois & King, Inc. (2017). Flood Mitigation Designs Deliver in First Major Storm After Irene. https://www.dubois-king.com/dk-flood-mitigation-design-delivers-first-major-storm-irene/
Dudley, R. W., & Hodgkins, G. A. (2013). Historical Groundwater Trends in Northern New England and Relations with Streamflow and Climatic Variables. JAWRA Journal of the American Water Resources Association, 49(5), 1198–1212. https://doi.org/10.1111/jawr.12080
Dudley, R. W., Hodgkins, G. A., McHale, M. R., Kolian, M. J., & Renard, B. (2017). Trends in snowmelt-related streamflow timing in the conterminous United States. Journal of Hydrology, 547, 208–221. https://doi.org/10.1016/j.jhydrol.2017.01.051
Dugan, H. A., Summers, J. C., Skaff, N. K., Krivak-Tetley, F. E., Doubek, J. P., Burke, S. M., Bartlett, S. L., Arvola, L., Jarjanazi, H., Korponai, J., Kleeberg, A., Monet, G., Monteith, D., Moore, K., Rogora, M., Hanson, P. C., & Weathers, K. C. (2017). Long-term chloride concentrations in North American and European freshwater lakes. Scientific Data, 4(1), 170101. https://doi.org/10.1038/sdata.2017.101
Dupigny-Giroux, L.-A., Mecray, E., Lemcke-Stampone, M., Hodgkins, G. A., Lentz, E. E., Mills, K. E., Lane, E. D., Miller, R., Hollinger, D., Solecki, W. D., Wellenius, G. A., Sheffield, P. E., MacDonald, A. B., & Caldwell, C. (2018). Chapter 18: Northeast. Impacts, Risks, and Adaptation in the United States: The Fourth National Climate Assessment, Volume II. U.S. Global Change Research Program. https://doi.org/10.7930/NCA4.2018.CH18
Farmland Information Center. (2016). Vermont Data and Statistics. Farmland Information Center. https://farmlandinfo.org/statistics/vermont-statistics/
Gillespie, N., Unthank, A., Campbell, L., Anderson, P., Gubernick, R., Weinhold, M., Cenderelli, D., Austin, B., McKinley, D., Wells, S., Rowan, J., Orvis, C., Hudy, M., Bowden, A., Singler, A., Fretz, E., Levine, J., & Kirn, R. (2014). Flood effects on road–stream crossing infrastructure: Economic and ecological benefits of stream simulation designs. Fisheries, 39(2), 62–76. https://doi.org/10.1080/03632415.2013.874527
Gourevitch, J. D., Singh, N. K., Minot, J., Raub, K. B., Wemple, B. C., Ricketts, T. H., & Rizzo, D. M. (2020). Spatial targeting of floodplain restoration to equitably mitigate flood risk. Global Environmental Change, 61(February), 102050. https://doi.org/10.1016/j.gloenvcha.2020.102050
Guilbert, J., Beckage, B., Winter, J. M., Horton, R. M., Perkins, T., & Bomblies, A. (2014). Impacts of projected climate change over the Lake Champlain basin in Vermont. Journal of Applied Meteology and Climatology, 53, 1861–1875. https://doi.org/10.1175/JAMC-D-13-0338.1
Guilbert, J., Betts, A. K., Rizzo, D. M., Beckage, B., & Bomblies, A. (2015). Characterization of increased persistence and intensity of precipitation in the northeastern United States. Geophysical Research Letters, 42(6), 1888–1893. https://doi.org/10.1002/2015GL063124
Henzel, L. (2016). Living in harmony with streams: A citizen’s handbook to how streams work (p. 48). https://floodready.vermont.gov/sites/floodready/files/documents/Stream%20Guide%2011-16-2016.pdf
Hodgkins, G. (2010). Trends in Streamflow Characteristics at Selected Stream gauges in Vermont.
Hodgkins, G. A., & Dudley, R. W. (2011). Historical summer base flow and stormflow trends for New England rivers. Water Resources Research, 47(7). https://doi.org/10.1029/2010WR009109
International Lake Champlain-Richelieu River Study Board. (2019). The causes and impacts of past floods in the Lake Champlain-Richelieu River Basin (p. 108). https://www.ijc.org/sites/default/files/2020-03/9056-CMI%20Rapport%20public%20EN-FINAL-HR.pdf
International Lake Champlain-Richelieu River Study Board. (2020). Lake Champlain-Richelieu River Basin: Understanding past floods to prepare for the future (p. 16). https://www.ijc.org/sites/default/files/2020-03/9092-CMI-BROCHURE-WEB-AN.pdf
Junk, W. J., An, S., Finlayson, C. M., Gopal, B., Květ, J., Mitchell, S. A., Mitsch, W. J., & Robarts, R. D. (2013). Current state of knowledge regarding the world’s wetlands and their future under global climate change: A synthesis. Aquatic Sciences, 75(1), 151–167. https://doi.org/10.1007/s00027-012-0278-z
Kaushal, S. S., Likens, G. E., Jaworski, N. A., Pace, M. L., Sides, A. M., Seekell, D., Belt, K. T., Secor, D. H., & Wingate, R. L. (2010). Rising stream and river temperatures in the United States. Frontiers in Ecology and the Environment, 8(9), 461–466. https://doi.org/10.1890/090037
Kirn, R. (2016, June 22). Stream Crossings I: Stream Sim Lite: Incorporating Stream Simulation Concepts into Vermont Statewide Culvert Design and Construction Standards. International Conference on Engineering and Ecohydrology for Fish Passage.
Kline, M. (2016). Giving Our Rivers Room To Move: A New Strategy and Contribution to Protecting Vermont’s Communities and Ensuring Clean Water. Vermont Journal of Environmental Law, 17(4), 733–765.
Kline, M., & Cahoon, B. (2010). Protecting River Corridors in Vermont. JAWRA Journal of the American Water Resources Association, 46(2), 227–236. https://doi.org/10.1111/j.1752-1688.2010.00417.x
Lang, V. (1999). Questions and Answers on the New England Flow Policy (p. 22). U.S. Fish and Wildlife.
LCBP. (2013). Flood resilience in the Lake Champlain Basin and Upper Richelieu River (p. 93). http://www.lcbp.org/wp-content/uploads/2013/04/FloodReport2013_en.pdf
LCBP. (2015). Climate Change and Stormwater Management in the Lake Champlain Basin (No. 80). http://www.lcbp.org/wp-content/uploads/2013/03/80_LCBP_ClimateChange_StormwaterMangement.pdf
LCBP. (2018). State of the Lake and Ecosystem Indicators Report (p. 36). Lake Champlain Basin Program. https://sol.lcbp.org/en/
LCBP, New England Interstate Water Pollution Control Commission, & Organisme de basin versant de la baie Missisquoi. (n.d.). Nutrient Loading and Impacts in Lake Champlain, Missisquoi Bay, and the Richelieu River. International Joint Commission. Retrieved April 22, 2021, from https://ijc.org/sites/default/files/2019-11/20191114_Missisquoi%20Bay%20Lit%20Review_LCBP_OBVBM_FR.pdf
Lester, S. E., Singh, N. K., Gourevitch, J. D., Wemple, B. C., Watson, K. B., & Rizzo, D. M. (2019). Optimizing wetland restoration to improve water quality at a regional scale.
Milligan, G., Poulos, H. M., Gilmore, M. S., Berlyn, G. P., Milligan, J., & Chernoff, B. (2019). Estimation of short-term C-fixation in a New England temperate tidal freshwater wetland. Heliyon, 5(5), e01782. https://doi.org/10.1016/j.heliyon.2019.e01782
Molinas, A., & Mommandi, A. (2009). Development of New Corrosion/Abrasion Guidelines for Selection of Culvert Pipe Materials.
Moomaw, W. R., Chmura, G. L., Davies, G. T., Finlayson, C. M., Middleton, B. A., Natali, S. M., Perry, J. E., Roulet, N., & Sutton-Grier, A. E. (2018). Wetlands In a Changing Climate: Science, Policy and Management. Wetlands, 38(2), 183–205. https://doi.org/10.1007/s13157-018-1023-8
Nahlik, A. M., & Fennessy, M. S. (2016). Carbon storage in US wetlands. Nature Communications, 7(1), 13835. https://doi.org/10.1038/ncomms13835
Paerl, H. W., & Huisman, J. (2008). Blooms Like It Hot. Science, 320(5872), 57. https://doi.org/10.1126/science.1155398
Ross, D. S., Wemple, B. C., Willson, L. J., Balling, C. M., Underwood, K. L., & Hamshaw, S. D. (2019). Impact of an Extreme Storm Event on River Corridor Bank Erosion and Phosphorus Mobilization in a Mountainous Watershed in the Northeastern United States. Journal of Geophysical Research: Biogeosciences, 124(1), 18–32. https://doi.org/10.1029/2018JG004497
Rousseau, Alain N. (2020). Watershed Storage: Assessment of the Role of Wetlands, Temporary Flooding of Farmlands and Potentially Developing Welands on Flows and Water Levels in the LCRR Basin. Lake Champlain-Richelieu River Study Technical Webinars. November 5. https://www.ijc.org/en/lcrr/watershed-storage-webinar-presentation
Schaible, G. D., & Aillery, M. P. (2017). Chapter 2.1.1—Challenges for US Irrigated Agriculture in the Face of Emerging Demands and Climate Change. In J. R. Ziolkowska & J. M. Peterson (Eds.), Competition for Water Resources (pp. 44–79). Elsevier. https://doi.org/10.1016/B978-0-12-803237-4.00004-5
Schiff, R., Bighinatti, S., Fitzgerald, E., Wahlund, N., Carlton, D., Church, A., Louisos, J., & Cote, B. (2015). Evaluating the costs and benefits of floodplain protections activities in Waterbury, Vermont and Willsboro, New York, Lake Champlain Basin, U.S.A. (Technical Report No. 78; p. 137). Lake Champlain Basin Program. http://www.lcbp.org/wp-content/uploads/2013/03/78_CostsBenefitsFloodplains.pdf
Shambaugh, A. (2020). Cyanobacteria Monitoring on Lake Champlain and Vermont Inland Lakes Summer 2019.
Singh, N. K., Wemple, B. C., Bomblies, A., & Ricketts, T. H. (2018). Simulating stream response to floodplain connectivity and revegetation from reach to watershed scales: Implications for stream management. Science of The Total Environment, 633, 716–727. https://doi.org/10.1016/j.scitotenv.2018.03.198
Smeltzer, E., Shambaugh, A. D., & Stangel, P. (2012). Environmental change in Lake Champlain revealed by long-term monitoring. Journal of Great Lakes Research, 38(1), 6–18. https://doi.org/10.1016/j.jglr.2012.01.002
State of Vermont. (2021). Flood Ready Vermont. https://floodready.vermont.gov/
Stockwell, J. D., Doubek, J. P., Adrian, R., Anneville, O., Carey, C. C., Carvalho, L., Domis, L. N. D. S., Dur, G., Frassl, M. A., Grossart, H.-P., Ibelings, B. W., Lajeunesse, M. J., Lewandowska, A. M., Llames, M. E., Matsuzaki, S.-I. S., Nodine, E. R., Nõges, P., Patil, V. P., Pomati, F., … Wilson, H. L. (2020). Storm impacts on phytoplankton community dynamics in lakes. Global Change Biology, 26(5), 2756–2784. https://doi.org/10.1111/gcb.15033
Tate, E., Rahman, M. A., Emrich, C. T., & Sampson, C. C. (2021). Flood exposure and social vulnerability in the United States. Natural Hazards, 106(1), 435–457. https://doi.org/10.1007/s11069-020-04470-2
US EPA. (2016). Phosphorus TMDLs for Vermont Segments of Lake Champlain (p. 72).
US EPA, O. (2013). Impacts of Climate Change on the Occurrence of Harmful Algal Blooms (EPA 820-S-13-001; p. 3).
USGCRP. (2018). Impacts, Risks, and Adaptation in the United States: Fourth National Climate Assessment, Volume II: [Reidmiller, D.R., C.W. Avery, D.R. Easterling, K.E. Kunkel, K.L.M. Lewis, T.K. Maycock, and B.C. Stewart (eds.)]. U.S. Global Change Research Program, Washington, DC, USA, 1515 pp. doi: 10.7930/NCA4.2018.
USGS. (n.d.). Trends in Water Use in the United States, 1950 to 2015. USGS Water Science School. https://www.usgs.gov/special-topic/water-science-school/science/trends-water-use-united-states-1950-2015?qt-science_center_objects=0#qt-science_center_objects
USGS. (2021). Vermont Water Use. New England Water Science Center. https://www.usgs.gov/centers/new-england-water/science/vermont-water-use?qt-science_center_objects=0#qt-science_center_objects
Voigt, B., Lees, Julia, & Erickson, Jon. (2015). An Assessment of the Economic Value of Clean Water in Lake Champlain. (Technical Report No. 81; p. 53). Lake Champlain Basin Program. https://www.lcbp.org/publications/assessment-economic-value-clean-water-lake-champlain/
VPR. (2020). A Boom Year For Blooms: Toxic Algae Closes Beaches, Raises Concern About Water Supplies. October 25. In Vermont Public Radio. https://www.vpr.org/vpr-news/2020-10-25/a-boom-year-for-blooms-toxic-algae-closes-beaches-raises-concern-about-water-supplies
VT ANR. (1996). Water Withdrawals for Snowmaking (pp. 1–7). Vermont Agency of Natural Resources. https://dec.vermont.gov/sites/dec/files/documents/wsmd-water-withdrawal-snow-rule-1996-02-15.pdf
VT ANR, & VT DEC. (2018). State of Vermont Water Quality Integrated Assessment Report. https://dec.vermont.gov/sites/dec/files/documents/WaterQualityAssessmentReport_305b_2018.pdf
VT DEC. (n.d.). Wetland Functions and Values. Department of Conservation. Retrieved April 5, 2021, from https://dec.vermont.gov/watershed/wetlands/functions
VT DEC. (2015). FEMA Community Information Systems data on Policies in Force and e911 points in SFHA.
VT DEC. (2018). Vermont Groundwater Management Plan. https://dec.vermont.gov/sites/dec/files/dwgwp/DW/2018%20Groundwater%20Management%20Plan.pdf
VT DEC, V. W. P. (2019). Wetlands 101. https://dec.vermont.gov/sites/dec/files/wsm/wetlands/docs/2014_Wetlands%20101.pdf
VT Emergency Management. (2018). 2018 Vermont State Hazard Mitigation Plan. https://vem.vermont.gov/sites/demhs/files/documents/2018%20Vermont%20State%20Hazard%20Mitigation%20Plan%20-%20Final%20Adopted_Interactive.pdf
Watson, K. B., Ricketts, T., Galford, G., Polasky, S., & O’Niel-Dunne, J. (2016). Quantifying flood mitigation services: The economic value of Otter Creek wetlands and floodplains to Middlebury, VT. Ecological Economics, 130, 16–24. https://doi.org/10.1016/j.ecolecon.2016.05.015
Wilson, G., Green, M., & Mack, K. (2018). Historical Climate Warming in the White Mountains of New Hampshire (USA): Implications for Snowmaking Water Needs at Ski Areas. Mountain Research and Development, 38(2), 164–171. https://doi.org/10.1659/MRD-JOURNAL-D-17-00117
Wironen, M., Bennett, E., & Erickson, J. (2018). Phosphorus flows and legacy accumulation in an animal-dominated agricultural region from 1925 to 2012. Global Environmental Change, 50, 88–99. https://doi.org/10.1016/j.gloenvcha.2018.02.017
Wolfe, D. W., DeGaetano, A. T., Peck, G. M., Carey, M., Ziska, L. H., Lea-Cox, J., Kemanian, A. R., Hoffmann, M. P., & Hollinger, D. Y. (2018). Unique challenges and opportunities for northeastern US crop production in a changing climate. Climatic Change, 146(1–2), 231–245. https://doi.org/10.1007/s10584-017-2109-7