Human Health in Vermont
Download chapter PDF and figures
Authors
Stephanie Clement
Lead author; Program Manager at One Tree Planted
Michael Mezzacapo
Contributing author to Food and Water section, Environmental Analyst, Agency of Natural Resources, State of Vermont
Citation
Clement, S., Mezzacapo, M.,, 2021. Human Health. In Galford, G.L., Faulkner, J. et al. (Eds), The Vermont Climate Assessment 2021. Burlington, Vermont: Gund Institute for Environment at the University of Vermont. DOI: 10.18125/kowgvg.
Table of Contents
- 8.1 Key Messages
- 8.2 Introduction: Climate Change and Health
- 8.3 Temperature and Human Health
- 8.4 Air Quality, Pollution, and Health Impacts
- 8.5 Extreme Weather Events
- 8.6 Vectors
- 8.7 Water and Food
- 8.8 Mental Health
- 8.9 Traceable Accounts
- 8.10 Acknowledgements
- 8.11 References
8.1 Key Messages
- Climate change affects human health by exacerbating existing health problems and amplifying conditions for new health problems.
- Individuals who are children, over 65 years of age, of low socioeconomic status, Indigenous, or have previous health issues are more vulnerable to the health effects of climate change.
- Warmer and more moist temperatures in Vermont are likely to create more habitat for disease-carrying ticks and mosquitoes.
- Increases in the number and severity of natural disasters in Vermont will likely increase the risk of injury, illness, and death.
- Climate change could affect the quality and safety of food and water, which could lead to increases in food and water-borne illnesses.
- Decreases in air quality will exacerbate existing chronic diseases and decrease water quality.
- Mental health is inextricably linked with environmental health. Impacts from climate change could contribute to mental health challenges.
8.2 Introduction: Climate Change and Health
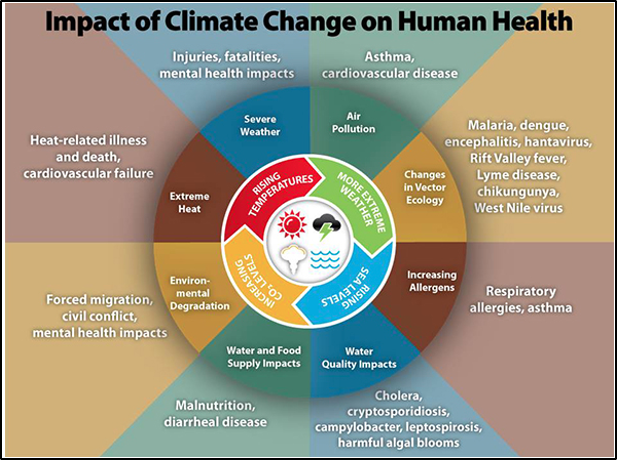
The myriad effects of climate change impact every part of the human body in one way or another, and climate change effects also disrupt health systems, supply chains, and health infrastructure (Salas et al., 2019; Lancet Countdown, 2020). Many changes are expected in Vermont, and all of these will have subsequent health impacts. For instance, increased heat waves, poor air quality days, and extreme weather lead to health-related impacts such as more emergency department (ED) visits, higher risk of respiratory illnesses, and increased occurrence of tick-borne diseases. Human health is, and will continue to be, detrimentally affected by the changes in climate (Figure 8-1). Particularly vulnerable populations to climate change are Vermonters sixty-five years and older, children under five years, pregnant women, Indigenous populations, and individuals in low-income communities (Melillo et al., 2014; USGCRP, 2018).
This chapter discusses: 1) climate change and how it will impact human health in Vermont; 2) how some demographics will be more vulnerable to these health impacts; and 3) actions we can take to lessen the impact. The many issues discussed in this chapter can be overwhelming in terms of number and types of actions, but readers should keep in mind that Vermonters can learn about and choose specific and individualized actions for each issue. In addition, the Vermont Climate and Health Program, a subset of the Vermont Department of Health, has many resources for further reading and information. Much of the data and information in this chapter is gleaned from the hard work of those who are part of that program.
8.3 Temperature and Human Health
Vermont, as a northern latitude state, experiences a wide range of temperatures throughout the year. The summers are warm and humid, and the winters are cold and dry. In the past, Vermonters generally have known what to expect from each season. However, in recent years, Vermont has begun to experience heat waves—prolonged abnormally high temperatures of several days or more—more frequently than ever before, as evidenced by three separate heat waves in the summer of 2020 alone (NOAA NWS Burlington, 2021). There has been an increase in the average annual minimum and maximum temperatures over time (see Physical Climate chapter), and these changes can have direct impacts on human health. Vermont already is seeing more heat stroke and dehydration from high temperatures and an associated increase in heat-related ED visits since 2003. With warming temperatures, the number of heat-related ED visits is expected to continue to rise, as discussed later in this chapter. In addition to an overall increase in temperature, other factors such as humidity, lack of wind, and physical exertion affect heat’s impact on human health. These impacts can include heat exhaustion and heat stroke, dehydration, cramping, sunburn, heat rash, and more.
8.3.1 Changes in Temperature from Climate Change
One way to understand changes in temperature is to track the number of extreme heat days, defined as days over 90°F (32°C). Since the 1960s, Vermont has experienced an average increase of 0.5 days over 90°F (32°C) per decade (see Physical Climate chapter). Warm summer nights are more frequent as well, with a trend of 0.5 more nights per decade above 70°F since the 1990s resulting in a net gain of 1.5 more warm nights per year since the 1960s (Figure 8-2) (Galford et al., 2014). In addition, three of the ten heat waves since 2010 occurred in 2020 (Figure 8-3), and, as of this writing (August 2021), two heat waves have occurred so far in 2021 (NOAA NWS Burlington, 2021). Compared to an average of seven extreme heat days per year in the early 2000s, climate scientists predict that Vermont is likely to experience 15–20 extreme heat days each year by 2050 and 20–34 extreme heat days each year by 2100 (VT Dept. Health, 2016a).
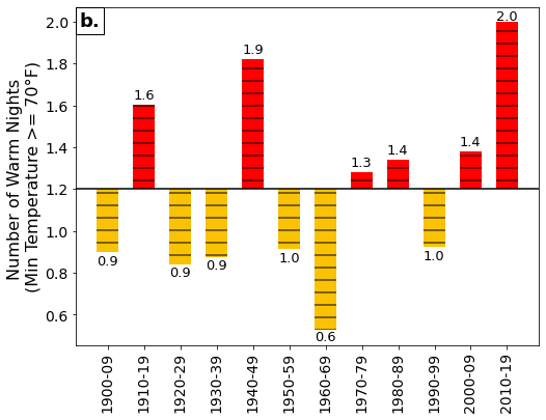
Note: Decadal averages are plotted above and below the 1900–2019 mean value (solid black line). See Physical Climate chapter.
| July 4 – 8, 2010 | 92 | 95 | 95 | 96 | ||
| Aug 31 – Sep 3, 2010 | 92 | 92 | 91 | 92 | ||
| July 21 – 23, 2011 | 97 | 95 | 93 | |||
| July 12 – 15, 2012 | 91 | 93 | 93 | 90 | ||
| July 15 – 19, 2013 | 93 | 91 | 95 | 91 | 98 | |
| Aug 17 – 20, 2015 | 90 | 91 | 90 | 91 | ||
| Sep 24 – 27, 2017 | 91 | 92 | 91 | 90 | ||
| Jun 30 – Jul 5, 2018 | 93 | 96 | 97 | 93 | 95 | 95 |
| Jun 18 – 23, 2020 | 92 | 91 | 94 | 94 | 96 | 96 |
| Jul 18 – 20, 2020 | 93 | 95 | 91 | |||
| Jul 26 – 28, 2020 | 92 | 93 | 91 | |||
| Jun 27 – 29, 2021 | 94 | 93 | 93 | |||
| Aug 24 – 26, 2021 | 90 | 90 | 94 |
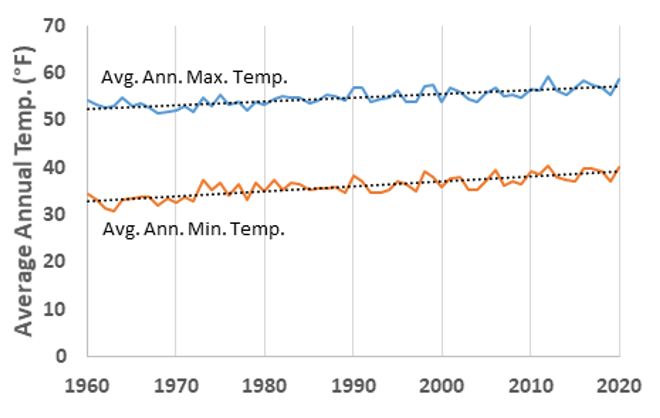
Note: Across Vermont, the average maximum temperature has increased by 0.5°F per decade from 1991-2020, while the average annual minimum temperature has increased significantly by 0.7°F per decade over the same period (see Physical Climate chapter). (xmACIS, 2021).
While the increase in extreme heat days impacts Vermont summers, winters are also changing. The average minimum temperature in Vermont has increased by 2.6℉ (1.4°C) from the 1960s to the 2010s (Figure 8-4) (Galford et al., 2014; Vermont Emergency Management, 2018). This means that as the highest temperatures increase, so do the minimum temperatures. This impacts cold-weather crops, such as field corn, wheat, oats, blueberries, and apples, which experience lower yields as temperatures increase (Dunnington, 2010). Milk production also decreases when temperatures are above 75°F (24°C), as ideal milking temperatures range from 40°–75°F (4–24°C) (Dunnington, 2010). The potential decline in yields of these staple foods could lead not only to negative economic impacts, but also to food shortages and subsequent health impacts related to the lack of available food.
While the absolute amount of degree change in average temperature over time in Vermont may seem small, climate change will have surprising impacts on extreme weather, the growing season, precipitation, water and air quality, and more (VT ANR, 2021). Impacts secondary to extreme heat events are discussed below.
8.3.2 Impacts of Heat on Human Health and the Environment
Nationally, extreme heat is characterized by high heat and humidity and temperatures that exceed 90°F (32°C) for two to three days or more. Extreme heat is responsible for the highest number of annual deaths among all weather-related hazards (ready.gov, 2021). In Vermont extreme heat is considered 87°F (31°C) or higher. The health impacts of extreme heat can be very severe as the body works hard to maintain normal temperatures. Heat can have serious impacts on Vermonters’ health, especially extreme heat (VT Dept. Health, 2016a). Vermonters are particularly at risk to extreme heat due in part to Vermonters’ physiological adaptation to cooler climates. Such adaptation means that the threshold temperature above which mortality increases is lower than in warmer climates (Kovats & Hajat, 2008). When the human body cannot cool itself down properly, a person can be at risk for heat illnesses. Heat illnesses include strokes, cramps, fainting, heat exhaustion, and heat stroke, which is life-threatening. In addition, vulnerable Vermonters, such as those who are more exposed to hot conditions, those who are older or more sensitive to heat, and those who have limited resources, may be at a higher risk during heat waves, especially if they do not have means to cool down. Extreme heat can also exacerbate certain environmental conditions and pre-existing health conditions, rendering individuals more vulnerable to heat-related illnesses (VT Dept. Health, 2021c).
According to the Vermont Department of Health (VDH), Vermont is not uniformly impacted by heat waves; rather, “the highest risk areas for heat illness were located in the northeastern counties of Orleans and Essex, along with the urbanized areas of Bennington, Montpelier, Rutland, St. Albans, and Vergennes” (VT Dept. Health, 2016a). This disparity in risk can be seen in the VDH’s vulnerability index maps, where each district and/or county is rated on its vulnerability to climate change based on several different factors: population size, environmental factors, acclimatization ability, socioeconomic status, health status, and heat emergencies (VT Dept. Health, 2016c). Overall, the highest vulnerabilities exist in northeast and southwest Vermont (Figure 8-5). Essex and Orleans counties, located in the far northeast of the state, also have the lowest incomes, with average annual incomes approximately $7,000 and $9,000 less per capita than the state average (U.S. Census Bureau, 2019).
Many residents of the main cities in Vermont are at higher heat illness vulnerability to climate change than other residents in their counties. This is likely due to factors such as the age of the population (where vulnerable individuals are under five and over sixty-five years old) and environmental factors such as dense housing, high proportion of paved areas, and lack of tree cover (VT Dept. Health, 2016c).
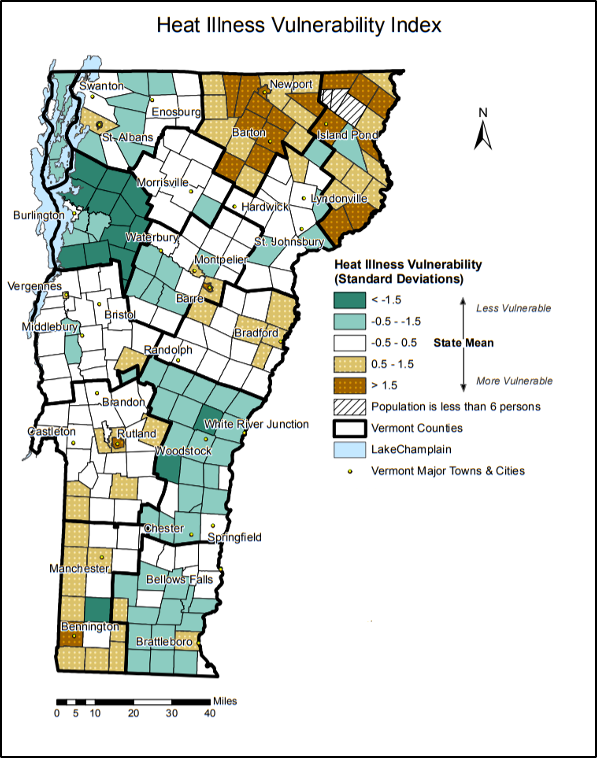
Note: Heat illness vulnerability in Vermont is based on town data, including population, environmental, acclimatization, socioeconomics, health, and heat emergency data (VT Dept. Health, 2016c)
Another indicator of the impact of extreme heat on health is the number of heat-related ED visits: ED visits “increase eight-fold when temperatures reach 87°F or higher” (VT Dept. Health, 2016a). The latest data on Vermonter’s ED visits from 2016 shows a general increase in overall visits since 2003 (Figure 8-6); this correlates with an increase in the number of extremely hot days, or days with temperatures greater than 90°F (32°C) (VT Dept. Health, 2016a, 2019b). In addition to heat stress, heat-related illnesses occur fifty times more frequently in urbanized areas in Vermont than in the peri-urban surrounding areas (VT Dept. Health, 2016a).
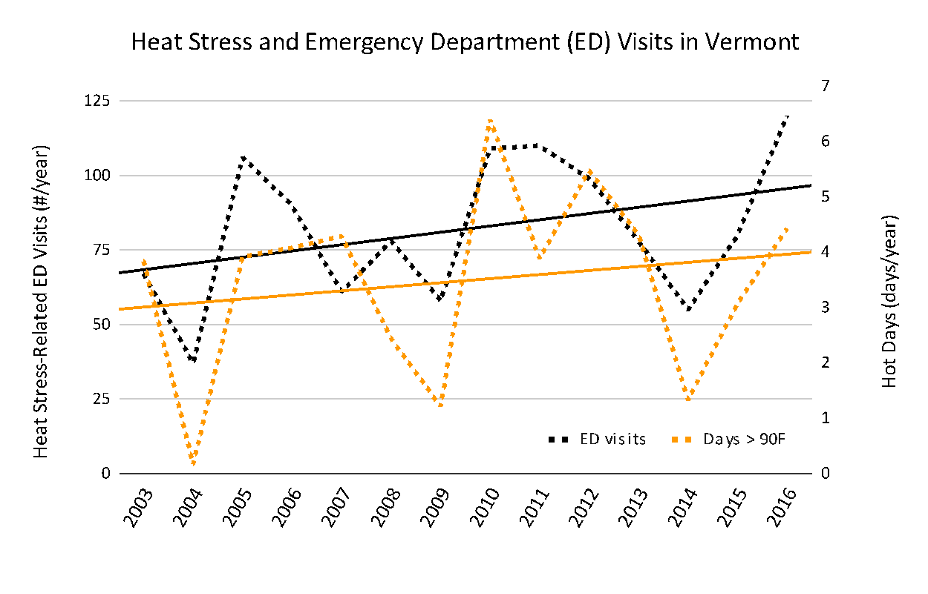
Note: Emergency department visits (VT Dept. Health, 2019b) and number of days >90°F (Physical Climate chapter). E.D. visits include any Vermonter visiting an E.D. in Vermont, New Hampshire, New York for all years, and Massachusetts for all years except 2014, 2015, 2016.
Secondary Heat-Related Health Impacts
Another result of extreme heat is an increase in mosquito-borne illnesses because an increase in temperature prolongs ideal temperatures for mosquitoes that carry diseases to thrive (VT Dept. Health, 2018f). In other words, Vermont should expect more mosquito days. An increase in temperature and number of hot days in Vermont is likely to increase the number of people getting vector-borne diseases that already exist in Vermont and to create a climate favorable for other mosquito-borne illnesses to spread (VT Dept. Health, 2018f). This is discussed more in depth in the Vectors section of this chapter.
Higher temperatures also mean changes to the water systems in Vermont. In Lake Champlain, for instance, there are algal blooms that shut down public beaches and make the water hazardous to swim in each year. Cyanobacteria, commonly called blue-green algae, is found naturally in freshwater. However, with consistent hot weather, cyanobacteria can flourish and multiply to create a green scummy film over the top of a body of water; this is called a bloom (VT Dept. Health, 2018e). Cyanobacteria have toxins called cyanotoxins that, at high levels such as during an algal bloom, are a hazard to human health as they can cause stomach pain, diarrhea, liver damage, skin rashes, runny noses, and sore throats (VT Dept. Health, 2018e). This is discussed further in the “Food and Water” section of this chapter.
Heat events impact air quality and worsen air pollution. Heat waves create stagnant air that traps pollution particles that are then breathed in. Increased temperatures also increase the likelihood for drought, which dries out vegetation. This vegetation is then more susceptible to wildfire, which also releases pollutants into the air (Peterson et al., 2014). Vermont’s growing season is lengthening (see Physical Climate and Agriculture chapters), which may impact the timing and duration of pollen (VT Dept. Health, 2018g). The combination of increased average temperatures and decreased air quality can change people’s engagement in outdoor activities and recreation, which may be associated with increased rate of obesity and cardiovascular disease. Even with increased indoor exercise, people may have reduced access to restorative emotional benefits of time spent outside.
The impacts of increasing temperatures on air quality clearly have a myriad of health impacts. Worsening air quality exacerbates respiratory illnesses such as asthma and lung cancer, and, as seen above, can impact general cardiovascular health. These impacts are discussed further in the Air Quality section of this chapter.
8.3.3 Impacts of Cold on Human Health and the Environment
In Vermont, winter weather can cause icy roads and disrupt power supply, which in turn can lead to dangerous conditions such as car accidents and leaving Vermonters without heat. In addition, cold can lead to hypothermia and frostbite. Frostbite “is an injury caused by freezing of the skin and underlying tissues. First your skin becomes very cold and red, then numb, hard and pale. Frostbite is most common on the fingers, toes, nose, ears, cheeks, and chin. Exposed skin in cold, windy weather is most vulnerable to frostbite. But frostbite can occur on skin covered by gloves or other clothing” (Mayo Clinic, 2019). Shoveling snow can “stress [the] heart and lead to a heart attack” (VT Dept. Health, 2021e). An increase in minimum temperatures in Vermont may have the positive effect of potentially decreasing the number of cold-related illnesses and deaths, although by 2050 Vermont may experience more icy conditions (see Physical Climate chapter), which pose different risks. Any winter warming benefits could be outweighed by an increase in heat-related illnesses and deaths (Ebi & Mills, 2013). Further, warmer winters may bring less precipitation falling as snow and more as ice or lead to spring recreation on dangerously cold-water bodies.
8.3.4 What You Can Do
Individuals and Outdoor Workers
While extreme heat events can be detrimental to health, there are still many ways to reduce the impacts of extreme heat. For individuals working or recreating outside, it is a good idea to develop a safety plan to address extreme heat days (VT Dept. Health, 2021c). The Centers for Disease Control and Prevention (CDC) and the National Institute for Occupational Safety and Health (NIOSH) have guidelines that workers can follow to protect their health and safety during hot days (NIOSH, 2016). Some of these suggestions include: implement a buddy system to keep an eye on indicators of heat stress, provide and drink plenty of cool water, increase airflow of an area, implement a heat alert system for extreme heat days, take frequent rests in the shade, implement a heat-related training program, and train workers on heat-related first aid (NIOSH, 2016; VT Dept. Health, 2021c).
In addition, there are technological tools to aid in heat-related events. One of these tools is the Heat Safety Tool mobile app sponsored by the Occupational Safety and Health Administration (OSHA) and NIOSH. While the tool is aimed towards individuals who work outside, it can be beneficial for anyone who enjoys being outdoors in warm weather or is particularly vulnerable to the effects of extreme heat. OSHA uses the heat index to “calculate the heat index and get associated risk level worksite recommendations” (NIOSH, 2016). In other words, it helps workers and companies take the appropriate safety actions according to the heat, humidity, and wind factors at their workplace.
Cities and Communities
While it is important to respond to heat events on the individual level, acting as a community is also essential for community and individual well-being and health. Similar to creating a work safety plan, communities and cities can create community response plans that specify particular actions to take on extreme heat days (VT Dept. Health, 2021c). One such plan is the Vermont Hazard Mitigation Plan (Vermont Emergency Management, 2018), which discusses changes in temperature and ideas for mitigation. However, having individualized plans for specific communities can be extremely beneficial, as each community has its own needs and resources.
Communities can also open cooling centers. These centers can be “any air-conditioned building that can be opened to the public, such as a library, town hall, or senior center,” (VT Dept. Health, 2021a). These centers include air conditioning, water access, seating, restrooms, and more, and can allow access to anyone (VT Dept. Health, 2021a). Along with cooling centers, communities can make sure to mobilize their care networks in order to make sure that those most vulnerable are being taken care of (VT Dept. Health, 2021a, 2021c).
Ensuring that buildings are energy-efficient is another action that communities can take to help reduce the impact of heat on human health (VT Dept. Health, 2021c). In addition, communities can encourage tree and shrub planting, thereby reducing the paved surface area that receives direct sun and contributes to urban areas being warmer than rural areas (Vermont Emergency Management, 2018; VT Dept. Health, 2021c, 2021a).
Homeowners and Landlords
Many of the above actions are short-term responses to heat events, not long-term actions. Homeowners and landlords can improve buildings to not only provide shelter from heat, but also improve the standards of living for many people at risk of heat illness. Homeowners and landlords may modify ventilation systems to increase flow of cool air, seal air leaks, weatherize the building properly, replace old lights with LED bulbs, install cooling devices such as air conditioners, and use light-colored construction materials to reflect light and heat (Hot Weather VDH, 2020). As mentioned previously, planting shrubs, vines, and trees can also be a longer-term solution to providing shade and preventing excessive urban heat (Vermont Emergency Management, 2018; VT Dept. Health, 2021c, 2021a).
8.3.5 Resources for Further Reading
- Vermont Department of Health Heat Webpage (2021) provides detailed information about heat events in Vermont and actions individuals can take.
- Vermont Department of Health Heat Vulnerability Index (2016) provides specific district-level information about vulnerability to heat in Vermont.
- Heat Waves in Burlington, Vermont (2020) lists heat waves from 1886 to present.
- Vermont Emergency Alert (2021) is where you can sign up to receive emergency alerts.
- Vermont Hot Weather Media Toolkit (2020) gives detailed information on heat changes in Vermont, the impacts, and the tools available for individual and collective action.
8.4 Air Quality, Pollution, and Health Impacts
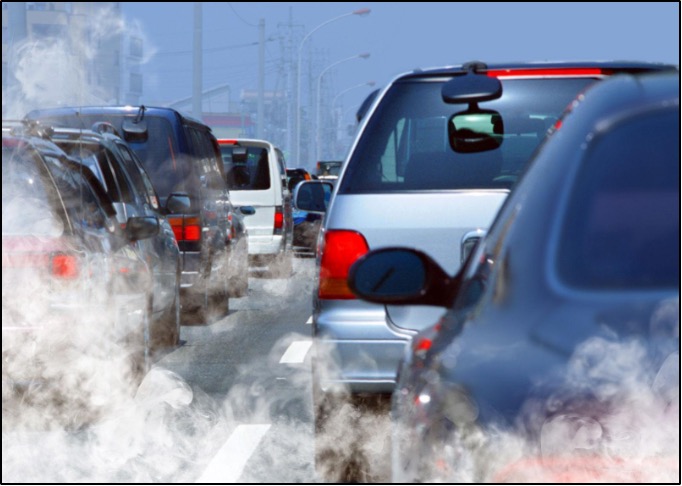
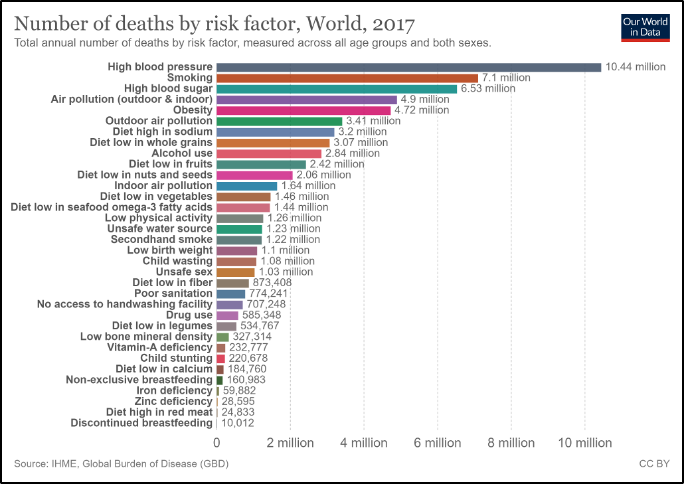
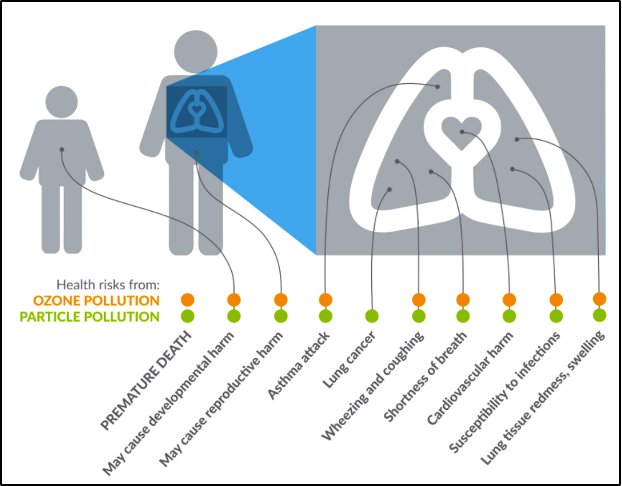
Climate change has a direct impact on air quality, as increased temperature and moisture levels in the atmosphere contribute to the distribution of allergens, pollutants, and irritants in the air (Dean & Green, 2018), and human activities simultaneously contribute to climate change and poor air quality (Figure 8-7). The WHO considers air pollution to be the “single largest environmental health risk” of climate change (Campbell-Lendrum & Prüss-Ustün, 2019; WHO, 2016), and the UN General Assembly ranked air quality as one of the top five major risk factors for human health (Figure 8-8) (Campbell-Lendrum & Prüss-Ustün, 2019). Approximately 9% of deaths are related to air quality issues (Ritchie & Roser, 2017; WHO, 2016) (see Fig. 7). Many noncommunicable diseases, such as asthma and chronic obstructive pulmonary disease (COPD), are exacerbated by poor air quality conditions.
Vermont is considered to have some of the cleanest air in the nation (VT DEC, 2021a). However, this does not mean that Vermont is immune to the impacts of pollution and aeroallergens, both of which affect the air we breathe. This air pollution can impact—or lead to—health conditions such as asthma, lung cancer, and heart disease (VT Dept. Health, 2021d). While, in general, Vermonters have not had to worry too much about air quality, there are certain climatic conditions that exacerbate air pollution (VT Dept. Health, 2021d). This section will discuss the types of air quality issues and the subsequent health impacts Vermont faces. It will also discuss the climatic changes likely to impact air quality, trends over time, and any changes to human health related to air quality. Finally, this section will discuss ways Vermonters can help reduce the impact of poor air quality on their health and work to improve Vermont’s air in general.
8.4.1 Air Quality: Pollution and Allergens
There are two types of air quality indicators. The first is air quality impacted by pollution related to both indoor and outdoor human activity. The two types of air pollution that result from human activity and dominate air quality in the US are ozone (O3) and particle pollution (American Lung Association, 2021). Ozone is emitted from smokestacks, vehicle exhaust, and among other sources. At ground level, O3 creates smog, is very harmful to breathe in, and is “like getting a sunburn on your lungs” (American Lung Association, 2021). Particle pollution is a mix of very small solid and liquid particles in the air and comes from exhaust from vehicles and industry (American Lung Association, 2021). Particle pollution is deadly and can exacerbate pre-existing health conditions like asthma and COPD.
Vermont does not experience high volumes of traffic, nor does it have large amounts of industry contributing to air pollution (VT Dept. Health, 2021d). In fact, Burlington and South Burlington are ranked in the top four cleanest cities in the nation with regards to air pollution (American Lung Association, 2021). However, Vermont’s air quality is impacted by pollution from outside of the state. For instance, in the summers of 2020 and 2021, the wildfires that ravaged California and western Canada produced enough smoke in the atmosphere that Vermonters could see a haze in the air from wildfire smoke for several days, an occurrence that is “far from the norm” (French, 2020). Therefore, while the state itself does not produce much pollution, it is not immune to the pollution from out of state. In addition, many Vermonters use wood as a source of heat for their homes; wood heat carries the risk of increased pollutants within the household. This pollution permeates the air we breathe, so we end up breathing in pollution particles, which can hurt our lungs and exacerbate pre-existing conditions like asthma. With the increase in hot days and precipitation that are anticipated with climate change, there is a likelihood that particle pollution and ozone episodes will be more frequent. In fact, temperature is the “most important meteorological factor in driving ozone episodes.” So, with increasing temperatures, ozone pollution will likely be more prevalent (Shen et al., 2016).
The second air quality indicator is related to allergens. The number of warmer days and projected increase in carbon dioxide in the atmosphere lengthens the growing season for many plants in Vermont (Galford et al., 2014). An increase in plant growth releases more pollen and other allergens into the atmosphere (VT Dept. Health, 2018g). This increases the likelihood of pollen in the air, which impacts air quality (VT Dept. Health, 2019g). For instance, one common allergen that affects many people is ragweed, and ragweed is likely to benefit from climate change and expand its range in Vermont (Case & Stinson, 2018). An increase in allergens in the atmosphere impacts people with existing heart and lung conditions by lowering the quality of air that we breathe. Finally, climate change may result in more mold growth in homes, which also impacts air quality (VT Dept. Health, 2018g).
8.4.2 Air Quality and Health Impacts
Particle Pollution
Respiratory illnesses and allergies are greatly impacted by air quality. Poor air quality can lead to issues such as lung cancer, asthma, and heart disease (Figure 8-9; VT Dept. Health, 2021d). In 2019, the EPA concluded that particle pollution:
- Causes early death from both long- and short-term exposure.
- Causes cardiovascular damage, including heart attacks, heart disease, and strokes.
- Likely worsens diseases such as asthma and COPD.
- Likely causes cancer and nervous system harm, as well as developmental harm. (American Lung Association, 2021)
In 2013 and again in 2020, the EPA concluded that O3 exposure:
- Causes worsening of pre-existing conditions like asthma and COPD.
- Likely causes early death from both long- and short-term exposure.
- Likely causes cardiovascular damage, including heart attacks, heart disease, and strokes.
- May cause nervous system and reproductive and developmental harm. (American Lung Association, 2021; U.S. EPA, 2013, 2020).
As these conclusions indicate, air quality has a direct impact on several aspects of human health. Not only do air pollutants cause damage in and of themselves, but they also exacerbate pre-existing conditions like asthma.
Aeroallergens
Climate change is lengthening the growing season in Vermont, and thus expanding the amount of time plants produce pollen and other such aero-allergens (VT Dept. Health, 2018g). The amount, concentration, and potency of pollen, spores, and other allergens in the atmosphere is thus increasing (K. R. Smith et al., 2014), triggering additional allergic responses and asthmatic reactions. Pollen and other aeroallergens can affect human health by creating itchy eyes, rashes, hives, runny noses, sinus issues, breathing problems, and more. One study showed that when there is a higher concentration of pollen in the atmosphere there are more ED visits due to asthmatic symptoms (Darrow et al., 2012). Thus, a longer growing season and increased plant growth due to increased carbon dioxide levels in the atmosphere from GHGs increases the likelihood of a longer aero-allergen season and a longer period of subsequent negative health effects. Another study found that over four million new childhood asthma cases could be attributable to nitrous oxide pollution, a pollutant in tailpipe emissions, industrial processes, and agricultural production (Achakulwisut et al., 2019). Urban centers host 64% of those cases.
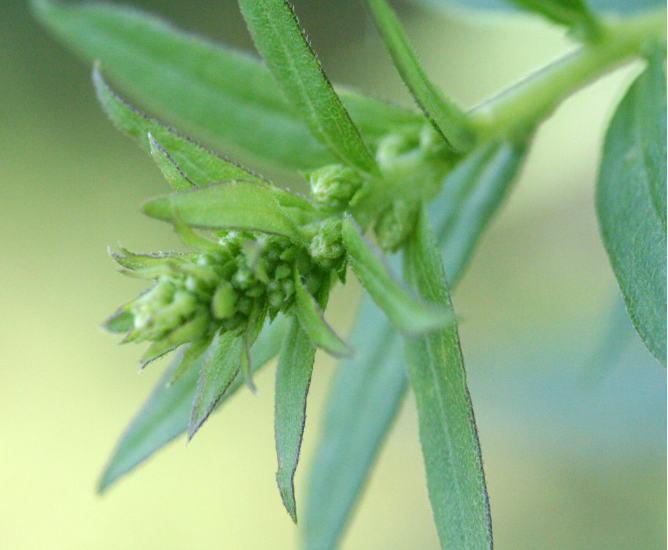
Box 8.1: Ragweed
Ragweed is a common plant that provokes many allergic reactions (Figure 8-10). The pollen produced by this plant stimulates reactions like itchy eyes, sneezing, and even asthma. With increased temperatures and carbon dioxide (CO2) levels in Vermont, there is likely to be an increase in ragweed flowering, duration, and pollen output (Stinson et al., 2016). One study warned that an increase in ragweed due to climatic changes in Vermont will necessitate monitoring and mitigating its presence and, since it grows primarily in disturbed soils, planning urban development and construction to minimize soil exposure and disturbance (Case & Stinson, 2018).
Asthma
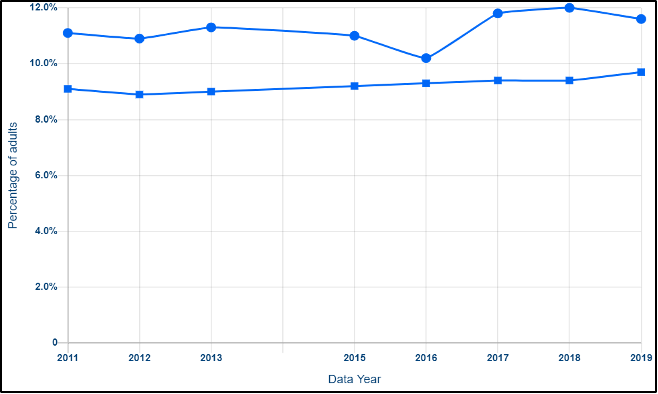
Asthma is a prevalent chronic respiratory condition that is triggered by environmental factors such as pollen, particulate matter, fuel, and pesticides (VT Dept. Health, 2021d). Asthma impacts approximately 11% of Vermont adults (Figure 8-11) (VT Dept. Health, 2018g). The number of Vermonters with asthma increased about 50% from 2000 to 2010 (VT Dept. Health, 2018g). This rate in Vermont is higher than the national average, and one of the highest rates in the northeastern United States (VT Dept. Health, 2019g). Some experts think Vermont has such high asthma because of Vermont’s older housing stock and lack of access to medical care due to the rural nature of the state (King, 2015). In addition, having pets is a trigger for asthma, and is a common link among those who have asthma in Vermont (King, 2015). During hot and humid days, more pollution (ozone and pollution particles) from vehicle emissions, wood smoke, and wildfires are trapped in the air and can exacerbate asthma (VT Dept. Health, 2019e, 2021d). Hot and humid days also can impact household mold, another trigger for asthma.
A
B
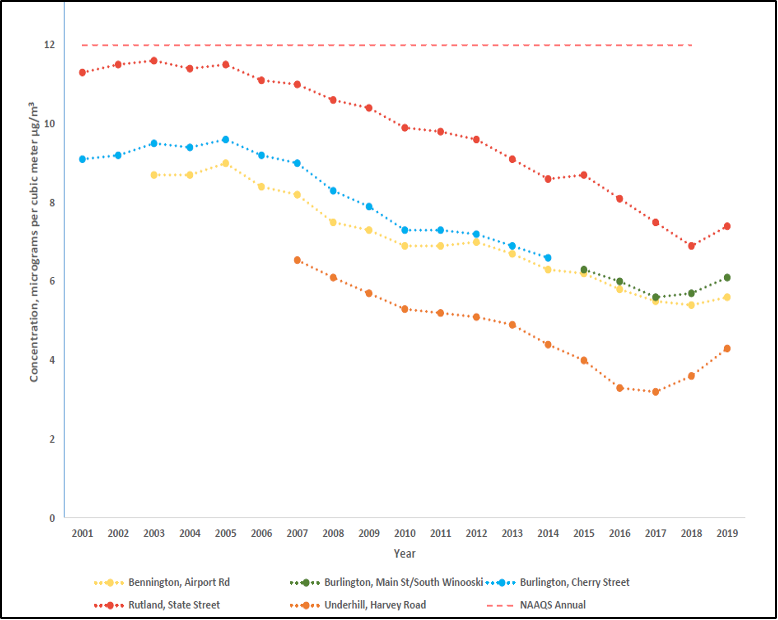
Note: Notice the spike in asthma rates in Vermont in 2016, just before an increase in particulate matter (Department of Environmental Conservation, 2021; United Health Foundation, 2021).
Asthma disproportionately affects people in lower socioeconomic groups. Among lower socioeconomic groups, the prevalence of asthma is 20%, compared to the statewide average of around 11% (VT Dept. Health, 2016b). This is due not only to potential environmental air quality factors, but also to increased risks of other comorbidities, low income housing, and smoking (VT Dept. Health, 2016b). A study in 2016 found that about four in ten lower income Vermonters were exposed to at least four or more negative environmental factors that exacerbate asthma (VT Dept. Health, 2016b). A state study found that smoking is almost twice as prevalent among Medicaid-insured Vermonters than other Vermonters, so these Vermonters and their families are more exposed to indoor smoke from cigarettes (VT Dept. Health, 2016b). This data points to socioeconomic disparities within Vermont that can be exacerbated by the burden of asthma, thus leading to even greater disparities.
Box 8.2: COVID-19 and Asthma
There is concern that individuals with asthma have increased risk of serious cases of COVID-19. Studies have shown that if asthma is well-managed, asthmatic individuals infected with COVID-19 have similar hospitalization rates as the general public (Terry et al., 2021). However, asthmatic individuals with moderate or severe asthma and are unable to manage their asthma are at a higher risk for hospitalization from a COVID-19 infection (CDC, 2021b). Because of the high rate of asthma in Vermont, the state has targets for decreasing and managing asthma in individuals. This would, in turn, help decrease the likelihood of hospitalizations from infections like COVID-19. The Respiratory Score Card indicates Vermont’s asthma goals and achievements (VT Dept. Health, 2019f).
8.4.3 What You Can Do
While air quality and air pollution are huge issues that are difficult to pinpoint or address singularly, Vermonters can take many actions to prevent poor air quality and thus address the subsequent health issues that arise.
Indoor Air Quality
There are three main factors to improving indoor air quality: improved ventilation, source control, and air cleaning (U.S. EPA, 2020). To act, Vermonters should examine sources of air pollution in the home (such as wood-burning stoves, gas stoves, old insulation, and moldy basements) and implement measures to address them, like cleaning wood stove chimneys, updating insulation, cleaning up mold, and making sure the home is well ventilated when using chemicals such as cleaning supplies. Installing carbon monoxide detectors or air filters also help with indoor air quality. To learn more about how to address these issues, go to the Vermont Department of Health’s Healthy Homes webpage (Figure 8-12) (VT Dept. Health, 2021b).
Note: Weatherization includes methods of protecting a building from outside elements like sunlight, precipitation, cold, and heat.
Wood Burning
At 22 pounds of particulate matter emissions per capita, Vermonters burn wood at the highest rate in the nation (Associated Press, 2015; Mingle, 2019). Around one in six Vermonters rely primarily on wood to heat their houses (US EIA, 2020). Considered a renewable fuel source, wood burning is a component of Vermont’s goal to be using 90% renewable energy by 2050 (VT Dept. Public Service, 2021). This includes the goal of increasing the percentage of Vermonters relying on wood fuel for heat from 21% to 35% by 2030 (Sherman et al., 2019).
Wood burning produces pollutant particles that can be inhaled and cause lung irritation, asthma attacks, and more (VT Dept. Health, 2017b). To reduce the impact of wood smoke on health, improving ventilation and filtration of the smoke is essential. Increasing the amount of outdoor air that circulates through the home (US EPA, 2014) and installing air purifiers, air monitors, and carbon monoxide detectors can help to reduce pollutants in the air and even detect when levels of wood smoke pollutants are high (VT Dept. Health, 2017b). In addition, because outdoor air quality tends to be poorer in the winter and at night, people who are sensitive to wood smoke should consider avoiding spending time outside when burning wood (VT Dept. Health, 2017b). The Vermont Department of Environmental Conservation suggests that Vermonters wishing to burn wood as a heat source in their homes have an energy expert assess the home and suggest efficient and clean wood stoves or boilers (VT DEC, 2021a). For instance, automated wood pellet heating greatly reduces the emissions emitted by wood burning while also effectively heating the home. State incentives, community outreach, and partnerships may help individuals make the transition to wood pellet burning and also adopt other alternative energies in their homes (Edling & Danks, 2021).
In the Home
There are many ways to reduce emissions and pollutants in the house. One is by using LED bulbs, which last longer and use less energy. Another way is by using energy-efficient appliances. They use less energy, which ultimately reduces the amount of pollutants emitted (VT DEC, 2021a). Efficiency Vermont is a good resource for learning about appliances and methods of improving your home’s energy use. Making sure that appliances are up to date and in good working order (i.e., by replacing filters, updating heating systems) helps with efficiency, too. Using cleaning products that are citrus-based and paints that are water-based latex ultimately help to reduce the number of irritants in your household. In addition, starting fires with natural starters, such as charcoal chimney starters, helps to reduce the amount of pollutants emitted in the home (VT DEC, 2021a).
Outdoor Air Quality
Reducing pollutants in outdoor air improves the air we breathe. When it comes to pollution in the air outside, some factors are out of our control, such as pollution swept in from neighboring areas. However, there are many things that Vermonters can do to improve local outdoor air quality, reduce emissions that contribute to greenhouse gas (GHG) emissions, and ultimately mitigate climate change. By doing these actions, Vermonters are not only protecting their health and the health of those they care for, but also helping Vermont meet its GHG reduction goals.
Travelling
Transportation is the largest contributor to GHG emissions in Vermont, which impacts climate change and the air we breathe (Figure 8-13) (Bureau of Transportation Statistics, 2017). While we rely heavily on fossil fuel-powered vehicles to get from one place to another, there are several ways to travel and reduce vehicle exhaust emissions. One is to ride a bike. This has the dual benefit of reducing GHG emissions and improving individual health through exercise. Public transportation is another option, as is carpooling. While the latter two options emit GHGs into the atmosphere, sharing transportation reduces total GHG emissions and thus reduces the amount of pollution in the air. Vermont has several resources related to public transport and signing up to carpool with others.
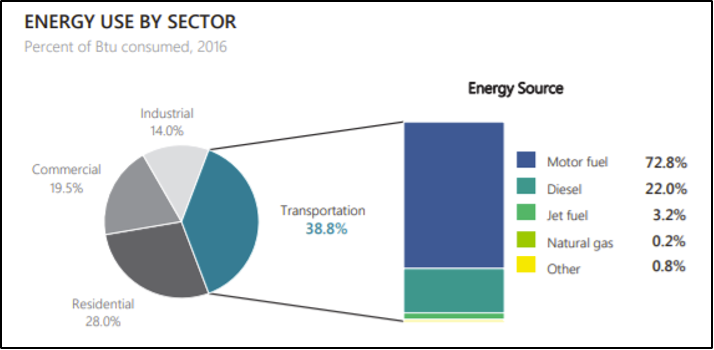
Note: The transportation consumes the most energy (in Btu—British Thermal Units) in Vermont. By walking, carpooling, and taking public transport, Vermonters can contribute to decreasing these numbers (Bureau of Transportation Statistics, 2017).
If it is necessary to use a car, the Vermont Department of Environmental Conservation suggests that people connect with others to share rides, limit idling in the car, and ensure your vehicle is up to date on maintenance (VT DEC, 2021g). In addition, keeping car tires fully inflated helps reduce gas usage, and avoiding topping up on gas can help prevent gas spillage (VT DEC, 2021g). Finally, switching to an electric or fuel-efficient vehicle has the multiple benefits of reducing emissions while conserving energy and saving you money. In Vermont, there are several incentives from the state, utilities companies, federal government, etc., to switch to electric vehicles (EVs) (Drive Electric Vermont, 2021). Drive Electric Vermont has more information on these incentives, including a calculator. Not only do these interventions help to improve air quality, they also help Vermont achieve its goal to reduce GHG levels to 40% below 1990 levels (State of Vermont, 2021b). Because personal transportation (i.e., cars, motorcycles, trucks) makes up about 45% of Vermont’s total GHG emissions, cutting down on driving can make a huge impact on GHG reduction and air quality (State of Vermont, 2021b).
RecreatingBefore exercising outside, consider checking the air quality index and the allergen forecast. Air quality can also be found via TV, radio, and newspapers. When pollution levels are high, avoid exercising outside. In addition, try to exercise away from busy roads or in high traffic areas, as these areas tend to have higher concentrations of pollutants from vehicles (American Lung Association, 2021).
8.5 Extreme Weather Events
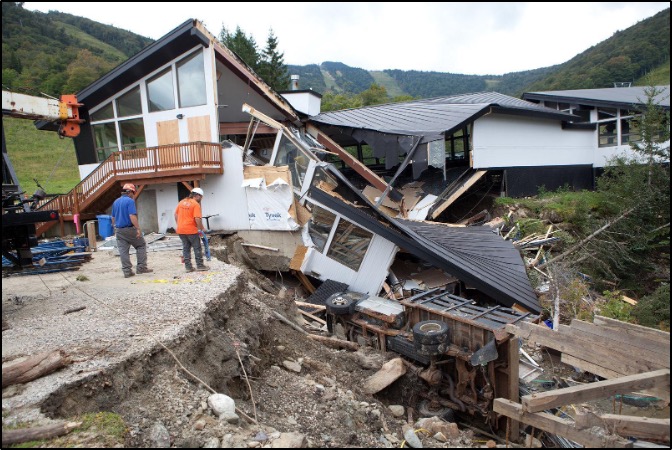
Extreme weather events—heat, storms, floods, and heavy rainfall, which are becoming more severe and frequent in the Northeast, including Vermont—increase the risk of injury, illness, and death (K. R. Smith et al., 2014; USGCRP, 2018). Precipitation events and flooding are the extreme weather events that pose the largest public health threat in Vermont. Hurricanes and tropical storms increasingly threaten the state, as seen by the devastation caused by Tropical Storm Irene on August 28, 2011 (Figure 8-14). Irene caused record flooding and severe damage to Vermont’s landscape, infrastructure, and economy, and it caused six deaths and many more direct and indirect physical injuries (VT Dept. Health, 2017a). The destruction caused by Irene to transportation infrastructure alone totaled $250 million, according to VTrans (National Wildlife Federation, 2016). Irene exemplified the risks of extreme weather events and brought climate change resilience conversations to the forefront for legislative and planning agendas in the state (Hewitt, 2016). This section will discuss the changes in extreme weather events in Vermont, the impacts of those events on human health, and actions Vermonters can take to address these issues.
8.5.1 Changes in extreme weather events
This section describes previous extreme weather events and examines the impacts of climate change on extreme weather events in Vermont. Vermont has experienced eighteen nationally declared disasters from 2010 to 2020, compared with eleven from 2000 to 2010 and twelve from 1990 to 2000 (Figure 8-15) (FEMA, 2021).
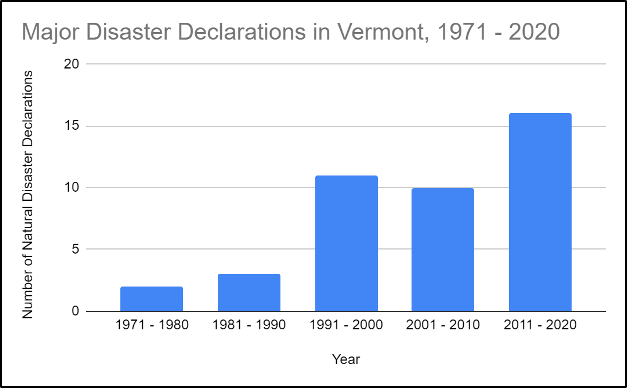
Note: Disasters include severe storms, precipitation, flooding, high winds, landslides, and freezes.
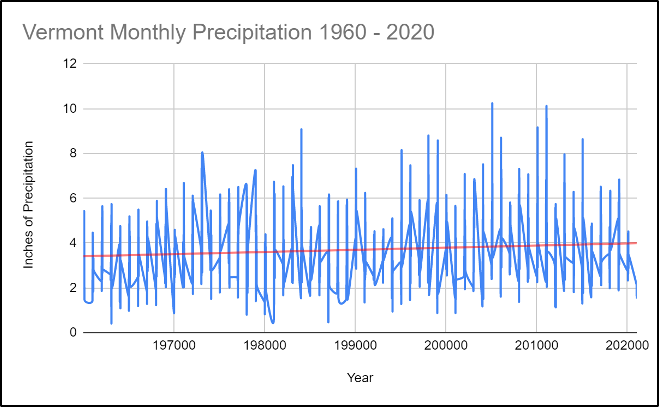
Precipitation
Vermont is getting wetter (Figure 8-16) (See the Physical Climate chapter). Since 1965, Vermont has seen an increase of seven inches in annual precipitation, and almost double the amount of precipitation days per year (VT Dept. Health, 2017a). In addition, Vermont is likely to see an increase in winter and spring precipitation, which initially will fall as snow, but increasingly will fall as winter rain (Galford et al., 2014) (see Physical Climate chapter). These changes have cascading effects on agriculture, plants, and human health, as will be discussed later.
Increased precipitation increases the potential for floods. Floods can destroy roads needed to transport people to the hospital and other health centers. Floods can cause physical injuries and death and can damage critical infrastructure. Vermont is prone to flooding from its rivers and streams and from storms like Tropical Storm Irene. During that storm, the changes to stream size were massive. Kevin Geiger of the Two Rivers Ottauquechee Regional Commission said, “There [were] streams that [weren’t] streams — streams that had no water in them (before the storm) — that split houses in half. You had streams you could step over carrying full-size trees” (State of Vermont, 2021a).
8.5.2 Impacts on health
Extreme weather events impact human health directly and indirectly from environmental and infrastructural damage.
Increased precipitation will create ideal growing conditions for household mold in buildings that are prone to dampness. As mentioned in the Air Quality section, mold can have serious impacts on respiratory health. In addition to exacerbating or causing respiratory issues (such as asthma, COPD, and allergies), long-term, low-level exposure to mold can cause fatigue, depression, concentration issues, and low immune responses (American Lung Association, 2021).
Damaged critical infrastructure—such as electricity, refrigeration, health care, and sanitation and water treatment—causes health risks. These include heat or cold issues from power outages, illness from spoiled food or water contamination, and mental health issues such as post-traumatic stress disorder (PTSD)(VT Dept. Health, 2017a; Wang et al., 2019). In addition, damaged infrastructure can disrupt medical treatment, especially problematic for those with chronic illnesses (see Box 8.3).
PTSD, anxiety, depression, and exacerbation of existing mental health issues are common during and after severe storms, such as Tropical Storm Irene (Wang et al., 2019). For instance, in town meetings in the town of Rochester immediately after Tropical Storm Irene, first one, then nine, then twenty-five residents were identified as needing urgent medical care or support for both mental and physical ailments (Shulins, 2014). When interviewed three years after the storm, multiple residents reported long-term emotional disturbances including anxiety, sadness, fear, and stress (Buschman et al., 2014).
Box 8.3: Rebuilding Mental Health Support After Tropical Storm Irene
The mental health impacts of Tropical Storm Irene persisted much longer than it took to rebuild much of the devastated infrastructure. After the destruction wreaked by Irene, including the damage of Vermont’s main mental health facility in Waterbury, the state had to scramble to provide mental health services and support to those impacted (Buschman et al., 2014). Irene brought to the forefront major issues within Vermont’s centralized mental health system, and Vermont has since restructured much of its mental health delivery to be based more on community-support than hospitalization (Hewitt, 2016). The storm catalyzed a state-level response to change the existing system to support individuals and fostered a strengthening of community closeness, support, and pride (Buschman et al., 2014).
Risks of infectious diseases increase with increased precipitation and storms, especially when people are exposed to overrun sewage systems and have skin wounds (REF: Rudolph & Harrison, 2016). An increase in vector-borne diseases (see Vectors section) is also possible, as often there is an increase in mosquitoes, and thus an increase in the risk of those mosquitoes carrying disease, after heavy storms and precipitation (REF: Rudolph & Harrison, 2016). While in Vermont there are now very few mosquito-borne illnesses, with increased temperatures and precipitation that is likely to change (see Vectors section).
8.5.3 What You Can Do
While extreme weather events can be devastating, there are things that individuals, communities, and the state can do to plan for them and reduce their impact. For more information on community resilience, see the Community Development chapter.
Infrastructure Improvement
Vermont has notoriously old infrastructure. In 2019, Vermont received a C letter grade for its infrastructure by the American Society of Civil Engineers (ASCE), with particularly bad grades for stormwater and wastewater infrastructure (both of which received a D+) (American Society of Civil Engineers Vermont Section, 2019). Old infrastructure leads to health risks, including air quality problems and physical danger from unsafe structures. When roads, buildings, bridges, and other infrastructure are not up to standards, they are more easily damaged by storms like Irene. This issue requires a multi-pronged solution that focuses on leadership, investment, and resilience at the state and federal levels. The ASCE suggests Congress fully fund infrastructure programs and fix the Highway Trust Fund (American Society of Civil Engineers Vermont Section, 2019). It also suggests that leadership focus on leveraging proven and emerging technologies to bolster infrastructure projects, make use of limited resources, scale up the use of natural or “green” infrastructure to enhance the resilience of various infrastructure sectors, and inventory state stormwater assets (American Society of Civil Engineers Vermont Section, 2019).
In Vermont, green infrastructure partnerships like the Green Infrastructure Collaborative aim to maintain and enhance the natural and environmental spaces within communities and cities. These partnerships emphasize the essential roles that natural spaces play in various sectors of society (e.g. increasing property values, rendering ecological services, and promoting human health and well-being) (VT DEC, 2021b). As previously mentioned, having tree cover within urban areas helps reduce the impact of extreme heat on health. In order to preserve these spaces, Vermonters can join the conversation, sign up for listservs, and volunteer to plant trees or other green infrastructure initiatives through Vermont Urban and Community Forestry’s webpage (VT UCF, 2021).
To learn more about green infrastructure, visit Vermont Urban and Community Forestry’s paper on green infrastructure’s roots and applications (VPIC, 2012). See also the green infrastructure section of the Community Development chapter.
Community Hazard Mitigation Planning
Risk Assessment: Understanding the risks that communities face is an important tool in planning for how to respond to these potential risks. One tool created after Tropical Storm Irene by Flood Ready Vermont is the Vermont Flood Ready Atlas (State of Vermont, 2021c), which overlays information on flood hazard areas on a map in order to visualize places at risk of flooding. This mapping tool helps to identify communities and residences that are within flood-prone areas in Vermont. Second, as of 2015, approximately 90% of Vermont’s communities participate in the National Flood Insurance Plan (NFIP), which insures buildings and communities in case of flooding (State of Vermont, 2021c). Yet another tool to assess communities’ status on flood preparedness and resilience is also from Flood Ready Vermont: community hazard reports. These reports are updated by communities around Vermont to assess: the level of flood risk, the status of certain infrastructure and the status of local mitigation action plans (State of Vermont, 2021c). According to the Vermont Economic Resilience Initiative (VERI), thirty-four towns were identified as economic centers that have high infrastructural and non-residential vulnerability to flooding. The ten towns with the most buildings in river corridors are listed in Figure 8-17 (VT Dept. Housing and Community Development, 2015).
| Town | Number of Non-Residential Buildings in the River Corridor |
|---|---|
| Montpelier | 300 |
| Barre City | 169 |
| Springfield | 154 |
| Woodstock | 140 |
| St. Johnsbury | 126 |
| Ludlow | 84 |
| Bennington | 80 |
| Brattleboro | 73 |
| Manchester | 69 |
| Wilmington | 69 |
Hazard Mitigation Planning: In 2018, the Vermont Division of Emergency Management, in partnership with other state agencies, released an updated Vermont State Hazard Mitigation Plan, which outlines plans to reduce the impacts or risks of natural hazards (VT Emergency Management, 2018). The Plan discusses how to mitigate the impacts of natural hazards, not how to mitigate the events themselves (Figure 8-18) (VT Emergency Management, 2018).
| Table 3: Hazzard Assessment | |||||||
|---|---|---|---|---|---|---|---|
| Hazard Impacts | Probablity | Potential Impact | Score*: | ||||
| Infrastructure | Life | Economy | Environment | Average | |||
| Fluvial Erosion | 4 | 4 | 3 | 4 | 4 | 3.75 | 15 |
| Inundation Flooding | 4 | 4 | 3 | 4 | 2 | 3.25 | 13 |
| Ice | 3 | 3 | 3 | 3 | 2 | 2.75 | 8.25 |
| Snow | 4 | 1 | 3 | 2 | 1 | 1.75 | 7 |
| Wind | 4 | 2 | 2 | 1 | 1 | 1.5 | 6 |
| Heat | 3 | 1 | 3 | 2 | 2 | 2 | 6 |
| Cold | 3 | 1 | 3 | 2 | 2 | 2 | 6 |
| Drought | 3 | 1 | 2 | 2 | 3 | 2 | 6 |
| Landslides | 3 | 3 | 2 | 1 | 2 | 2 | 6 |
| Wildfire | 2 | 3 | 3 | 3 | 2 | 2.75 | 5.5 |
| Earthquake | 2 | 3 | 3 | 3 | 2 | 2.75 | 5.5 |
| Invasive Species | 2 | 1 | 1 | 2 | 3 | 1.75 | 3.5 |
| Infectious Disease Outbreak | 2 | 1 | 3 | 2 | 1 | 1.75 | 3.5 |
| Hail | 3 | 1 | 1 | 1 | 1 | 1 | 3 |
| *Score = Probability x Average Potential Impact | |||||||
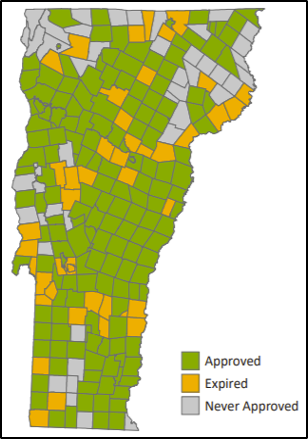
The Plan also discusses different mitigation and actions, including Hazard Mitigation Assistance, public assistance programs, and the Emergency Relief and Assistance Fund (ERAF), which provide a degree of disaster insurance to those at risk from natural disasters. Planning for the disaster eventualities allows towns and municipalities in Vermont to understand the risks and make sure there are plans and actionable items to enact in case of a natural disaster. As of September 2018, Vermont had 173 approved Local Hazard Mitigation Plans (LHMPs), constituting 63.7% of the state’s plans, 50 expired LHMPs, and 52 municipalities without any approved LHMP (Figure 8-19) (VT Emergency Management, 2018). Ensuring that all municipalities in Vermont have current LHMPs will help the state with regards to hazard mitigation.
Community members can engage with the local hazard mitigation chapter, sign up for VT Alerts, and keep up-to-date on local hazard mitigation plans to keep abreast of how Vermont and its local communities are reacting to and preparing for future hazards.
Box 8.4: Starting Over Strong Vermont
After Tropical Storm Irene damaged or destroyed many residential homes and much state infrastructure, many people were left without access to crisis support. Enter Starting Over Strong (SOS) Vermont, a federally funded organization that deploys small teams of crisis support workers to communities impacted by crises and provides psycho-educational support and short-term interventions to struggling individuals and families struggling. SOS Vermont hosted community gatherings to promote the creation of support groups, to build resilience, or just to share stories. SOS Vermont is an excellent example of a short-term, post-disaster intervention that helps individuals and communities recover after disasters (Aikman, 2012).
8.6 Vectors
Climate change is increasing the spread of vector-borne diseases across the United States and around the world (Githeko et al., 2000; Rocklöv & Dubrow, 2020; K. R. Smith et al., 2014). Briefly, warmer temperatures are more ideal environments for organisms such as mosquitoes and ticks, insects that can spread diseases like malaria, Lyme, chikungunya, Zika, etc. (Rocklöv & Dubrow, 2020). Because Vermont is likely to experience a warmer environment as the climate changes, there is likely to be an increase in the diseases spread by vectors. This section will discuss the changes in vector ecology (study of disease-bearing organisms) and tick-borne and mosquito-borne diseases, how Vermonters are impacted by these changes, and what Vermonters can do to address these changes.
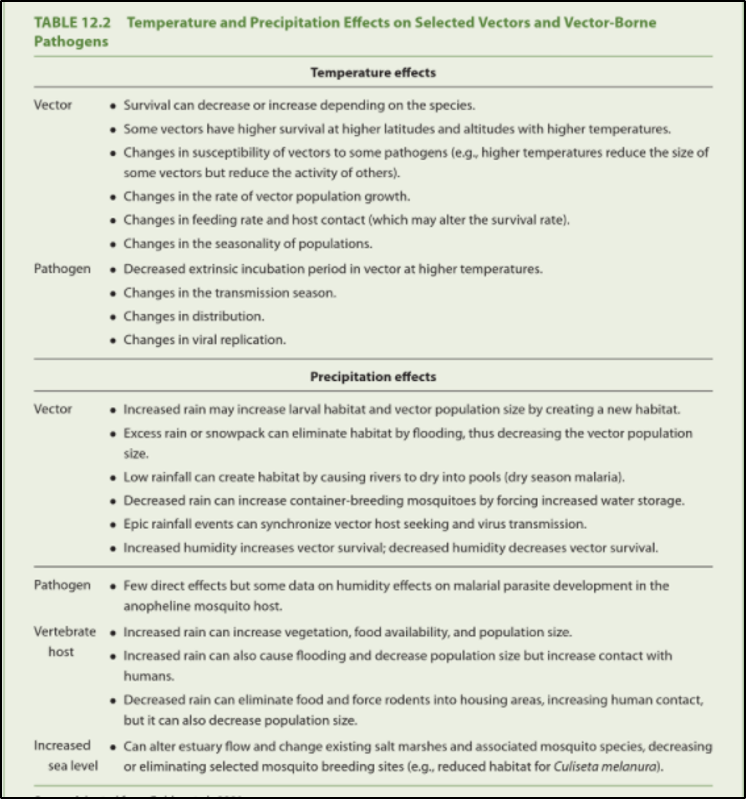
Vector-borne diseases are particularly responsive to climate change for several reasons (Figure 8-20). Climate change may shift the geographic range where the vector may live; reduce natural controls (such as die-off caused by winter freezing) on vectors and hosts; influence the life cycle of a pathogen; or affect the incubation time of a pathogen within its vector, leading to an increase in reproductive and biting rates (Patz, 2003; Patz et al., 1996, 2000; Patz & Frumkin, 2016; USGCRP, 2018). Hotter summers and warmer winters will allow tick-borne diseases, such as Lyme disease, Anaplasmosis, and Babesiosis, to flourish. Other vector-borne diseases, such as West Nile Virus and Eastern Equine Encephalitis, will also increase. All these factors lead to an increased risk of contracting a vector-borne disease, especially for populations already living in or near the geographic area where the diseases are present (K. R. Smith et al., 2014). Monitoring and controlling vectors like ticks and mosquitoes in Vermont will become an extremely important task as the climate continues to warm.
8.6.1 Tick-Borne Diseases
Tick-borne diseases are increasing in Vermont (Allen et al., 2019). Climate change has expanded the areas where ticks live and breed, and thus the areas where disease occurs. Diseases from vectors such as ticks that have not been seen in Vermont will start to become prevalent, and those that are already here will become more pervasive. In Vermont, tick-borne diseases are generally most prevalent in southern counties, but the trend could move northward with climate change. Longer summers not only could change vector distribution and biology, but also could lengthen the prime transmission period for these diseases (Figure 8-21). The Vermont Department of Health states succinctly:
Ticks can only live in areas where the climate is suitable for them, having the right temperature and the right amount of moisture. Warming temperatures due to climate change, especially during the winter months, may make Vermont more hospitable to blacklegged ticks. Warmer winters can also help the survival of important hosts for ticks, like white-footed mice. This could result in tick populations increasing in areas where they are already present, and the introduction of ticks to areas that were not previously infested, such as colder, northern areas and areas at higher elevations […] Ticks are typically not active at temperatures below freezing. Warming temperatures due to climate change mean more days when ticks are active and looking for blood meals, which means a greater risk of ticks biting people.
(VT Dept. Health, 2018c).
Additionally, ticks prefer warm, moist weather, which is likely to become more prevalent in New England as global temperatures increase (Polhamus, 2017). In Vermont, there are fourteen known types of ticks, four of which carry disease. The most abundant is the blacklegged tick, or deer tick, which is responsible for over 99% of all tick-related diseases, including Lyme, babesiosis, and anaplasmosis (VT Agency of Agriculture, Food and Markets, 2021b; VT Dept. Health, 2018c). The spread of tick-borne diseases depends on three factors: how many ticks are in the area, how many ticks are infected, and how often people encounter those ticks (VT Dept. Health, 2018c).
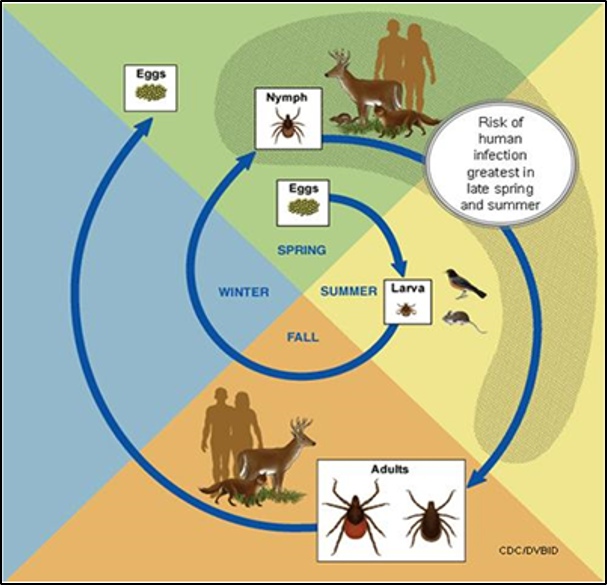
Note: Eggs are laid in the spring, larvae hatch in the summer, nymphs emerge the following spring and summer, and adults emerge in the fall and following spring (VT Agency of Agriculture, Food and Markets, 2021b).
Lyme Disease
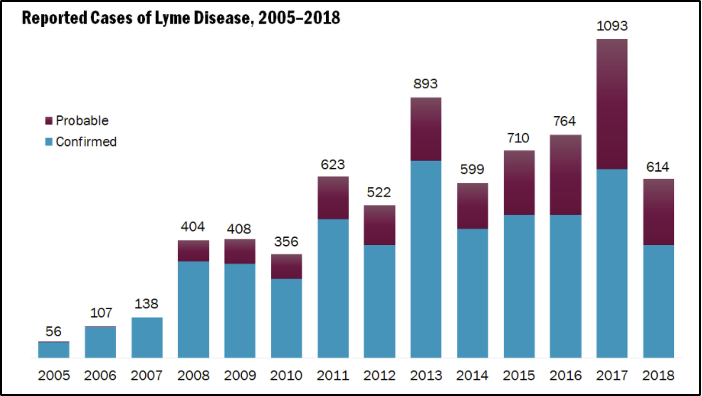
The most common tick-borne disease in Vermont, Lyme disease is caused by the Borrelia burgdorferi bacterium, which is spread to humans through the bite of the blacklegged tick (VT Dept. Health, 2019c). First described in the 1970s, the number of cases of Lyme disease in the United States has more than doubled since 1997 and has significantly increased since 2005 (see Figure 8-22) (Allen et al., 2019; Dumic & Severnini, 2018; Patz & Frumkin, 2016; VT Dept. Health, 2018c). In addition, there has been a shift in geography of Lyme disease northward, impacting states like Vermont at higher rates (Allen et al., 2019). In 2017, Vermont had the highest rates of Lyme in the country: 1,093 confirmed and probable cases, as compared to 138 cases just a decade before in 2007 (VT Dept. Health, 2018c).
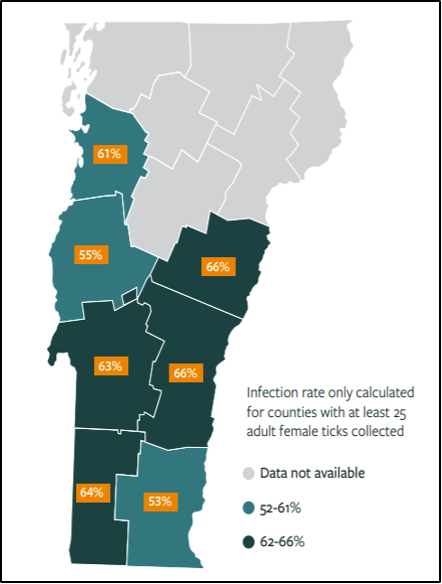
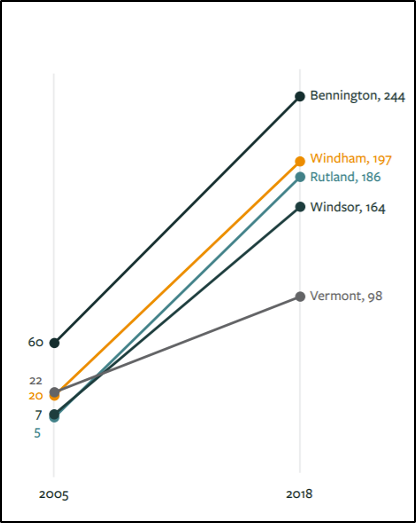
A study of ticks and tick-borne illnesses in Vermont in 2018 found that over half the female ticks collected and tested were positive for the Lyme disease bacterium (Figure 8-23). In addition, a study of the incidence of Lyme by country in the period 2005–2018 showed that Bennington, Windham, Rutland, and Windsor counties in southern Vermont had the highest incidences of Lyme in 2018 (Figure 8-24) (VT Dept. Health, 2018c). Cases have drastically increased since 2005. While the study indicates prevalence in southern counties, Lyme disease now has occurred in all counties in Vermont.
Symptoms of Lyme disease often include fever, chills, muscle pain, joint pain, headache, fatigue, and the Erythema migrans skin rash (CDC, 2018). This rash often appears at the site of the tick bite and gradually expands, forming a bullseye appearance. If not treated, the infection can spread to joints, the heart, and the nervous system. Lyme can be diagnosed by a healthcare provider based on symptoms, physical examination, the possibility of exposure to infected ticks, and laboratory tests. If diagnosed in a timely manner, most cases of Lyme disease can be successfully treated with antibiotics (VT Dept. Health, 2019c).
Anaplasmosis
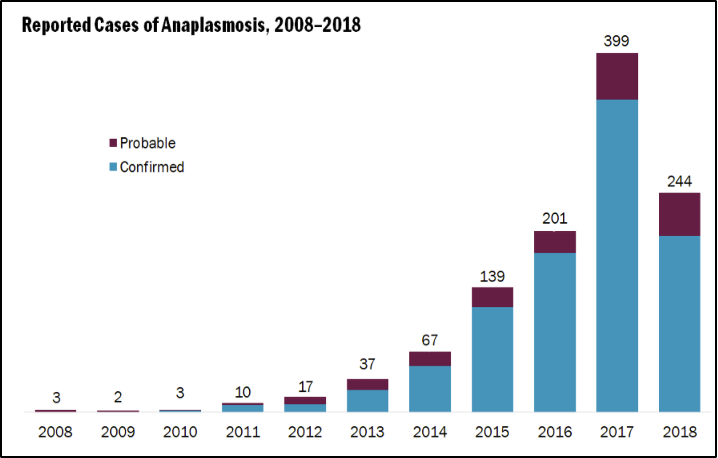
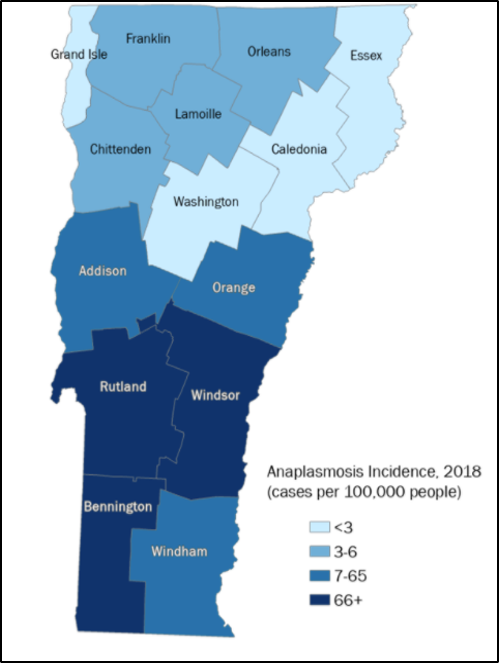
Like Lyme disease, anaplasmosis is transmitted by the blacklegged tick; it is the second most common tick-borne illness in Vermont (VT Dept. Health, 2018c). Anaplasmosis is caused by the bacterium, Anaplamsa phagocytophilium. Incidence of the illness has increased drastically since 2008: three cases were reported in 2008, almost 400 cases were reported in 2017, and 244 cases reported in 2018 (Figure 8-25) (VT Dept. Health, 2019c). The illness has been reported throughout Vermont, but in 2018 over 30% of cases occurred in Bennington County (Figure 8-26) (VT Dept. Health, 2018c). Anaplasmosis occurs more commonly in older Vermonters, and more often in males than in females (VT Dept. Health, 2018c). Everyone is at risk for contracting anaplasmosis, from spring to autumn.
Symptoms of anaplasmosis include, fever, chills, headache, myalgia, nausea, vomiting, diarrhea, loss of appetite, cough, and, in rare cases, a rash (CDC, 2018). Anaplasmosis is generally treated by antibiotics.
Babesiosis
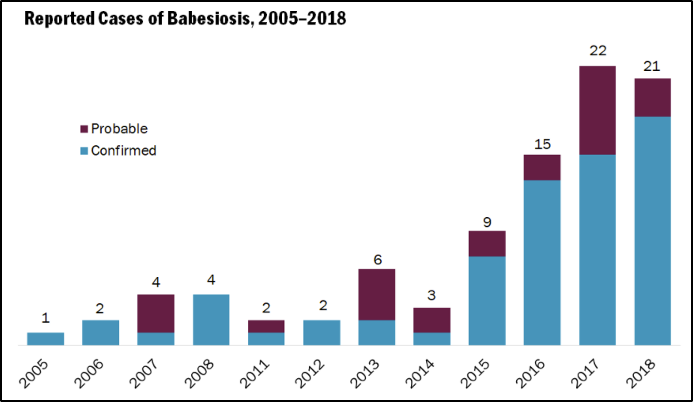
The third most common tick-borne illness in Vermont, babesiosis is caused by a microscopic parasite (Babesia microti) that is transmitted to humans by the blacklegged tick, the same tick that transmits Lyme disease and anaplasmosis (VTLyme.org, 2018). Babesiosis can also be transmitted, albeit less commonly, by blood transfusion or, even more rarely, from mother to unborn baby via congenital transmission (CDC, 2018). The disease, although less common than Lyme, has also drastically increased since 2005: only one case was reported in 2005, but twenty-one cases were reported in 2018 (Figure 8-27) (VT Dept. Health, 2018c).
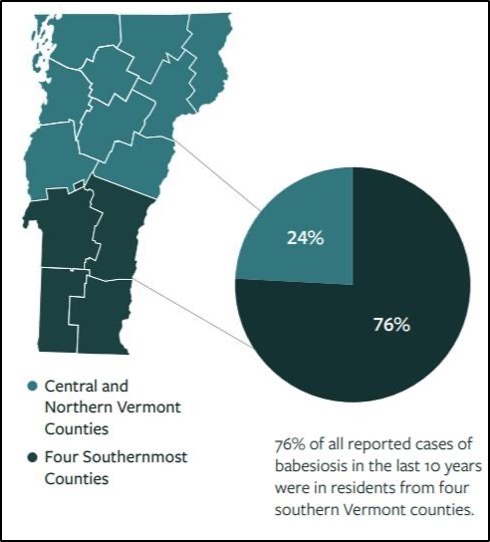
Unlike Lyme, in which boys aged 5-14 and older men have the highest reported cases, most reported cases of Babesiosis in Vermont have been adults aged fifty five years and older (VT Dept. Health, 2018c). Like Lyme and anaplasmosis, however, the cases have mostly been in the state’s southernmost counties (Figure 8-28) (VT Dept. Health, 2018c).
Many people who are infected with the babesiosis parasite do not experience symptoms. However, if symptoms do present, often they include chills, fever, headache, sweats, body aches, loss of appetite, nausea, fatigue, and occasionally a type of anemia that leads to jaundice (CDC, 2018; VTLyme.org, 2018). Symptoms will generally present one to four weeks after the tick bite. Blood tests can diagnose babesiosis.
8.6.2 Mosquito-Borne Diseases
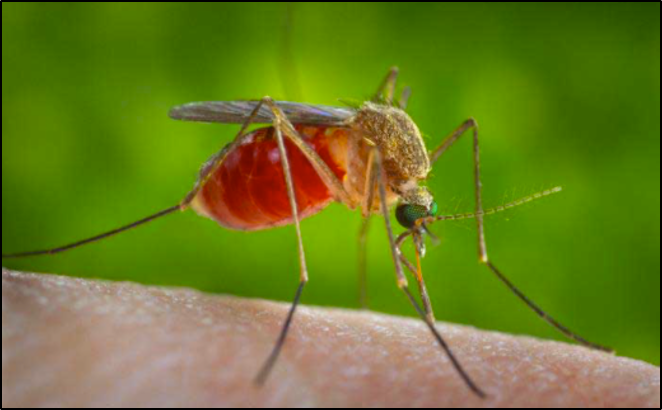
Mosquito-borne diseases are increasing in Vermont. While many Vermonters are familiar with the annoying sound of mosquitoes buzzing in the ears during summer and the itchy welts the bites cause, the idea of mosquitoes carrying disease is uncommon (Figure 8-29). However, two mosquito-borne diseases exist in Vermont: West Nile Virus (WNV) and Eastern Equine Encephalitis (EEE). Mosquitoes are inactive around 50℉ (10°C) and lower, become lethargic around 60℉ (16°C), and become much more active around 80℉ (27°C). Further, the time of development from egg to adult drops sharply from about 60 days at 59℉ (15°C) to 12 days at 68°F (20°C) and then declines further to about 6 days at 80–93℉ (27–34°C) (Rocklöv & Dubrow, 2020). With increasing temperatures, the transmission season in Vermont will lengthen, thus providing an environment for increased spread of WNV and EEE. These two illnesses are not prevalent in Vermont as of 2021. With climate change, Vermont is likely to see an increased risk of WNV and EEE as well as the potential of in-migration of mosquito species not previously in Vermont and with them the potential of different diseases (VT Dept. Health, 2018f).
The United Nations International Panel on Climate Change (IPCC) declared mosquito-borne illnesses the most susceptible to climate change (K.R. Smith et al., 2014). Because mosquitoes are cold-blooded, they are largely sensitive to climate fluctuations (Ludwig et al., 2019; Patz, 2003). In addition, changes to climate impact mosquitoes’ biting rates, survival, development, distribution, and range (Patz, 2003). Key climate changes that affect mosquitoes are increases in temperature and precipitation—both of which are expected to occur in Vermont (Ludwig et al., 2019). Especially significant are changes to precipitation: increased precipitation is linked to increased mosquito prevalence to a point, and then excess precipitation washes away larvae and eggs, while lack of precipitation creates stagnant pools where mosquitoes lay their eggs and live during early stages of development (Ludwig et al., 2019). Similarly complex, increases in temperature tend to decrease mosquito longevity but increase viral transmission rate, especially for EEE (Githeko et al., 2000).
West Nile Virus
WNV is an arbovirus that is rare in Vermont, with three reported cases or fewer per year from 1999–2019 (CDC, 2020a). With the first appearance of WNV in the United States in 1999 in New York City, the disease spread to other states, and even across the country by 2003 (Paz, 2015). Due to the dependence of the transmission cycle on climate conditions, changes in precipitation and increased temperatures in Vermont will encourage an increase in mosquitoes that carry WNV (Paz, 2015). Increased temperatures correlate with increased WNV replication rates, growth rate of vectors, viral transmission rate to birds, lower incubation time, and less amount of time between blood meals for mosquitoes (Paz, 2015). Increased precipitation has been found to lead to increased abundance of mosquitoes with WNV in the eastern US, and increased potential for disease outbreak in humans (Paz, 2015).
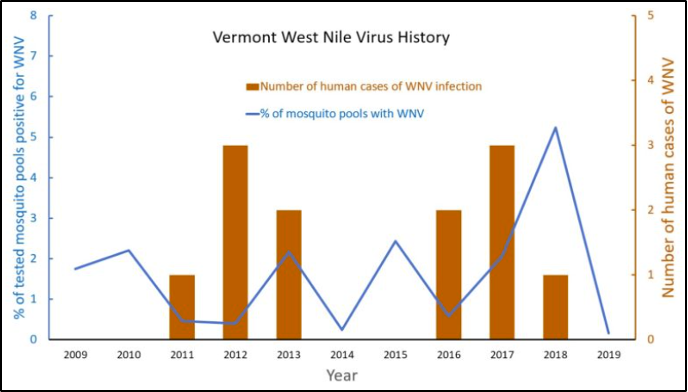
In Vermont, the Vector Surveillance Program monitors mosquito populations throughout the state and tests mosquitoes for WNV and EEE (Figure 8-30). In 2020, there were zero cases of WNV-infected mosquitoes (VT Agency of Agriculture, Food and Markets, 2020). However, in 2019, five mosquitoes had WNV (0.16% of total mosquitoes collected); in 2018, 157 mosquito pool samples were positive for WNV out of 2,997 pools (0.05%); and in 2017, 89 mosquito pools were positive for WNV out of 4,306 pools (0.02%) (VT Agency of Agriculture, Food and Markets, 2017, 2018, 2019a). These percentages are quite low, but with the changes expected in Vermont’s climate, it is important to keep an eye on the changes in the amount of WNV, too. Since WNV has been found in 65 different mosquito species, the opportunity for geographical expansion, as well as increased rates in areas where it is already endemic such as in Vermont, is high. Not all mosquitoes have the same role in transmitting the virus: some species may contribute to early season amplification or serve as accessory bridge vectors in certain regions (Kilpatrick et al., 2005).

Symptoms of WNV include fever, headache, body aches, rash, and swollen lymph glands (VT Dept. Health, 2019d). Unfortunately, the virus has no cure, but symptoms can be treated. The disease is transmitted most frequently and commonly by mosquito bites (CDC, 2020a). However, it can also spread by blood transfusion and from mother to baby during delivery or via breastfeeding (CDC, 2020a). The occurrence of the disease is believed to be cyclical in nature, with low number years followed by two to four years of increased cases (Figure 8-30) (Fastie, 2019).
Eastern Equine Encephalitis
EEE is a rare neurological disease caused by a virus carried and transmitted by mosquitoes (CDC, 2020a). The incidence is rare in the United States, with nine confirmed cases in the country as of October 2020 (CDC, 2020c). The first outbreak of EEE in Vermont occurred on an emu farm in Rutland County in 2011 (Figure 8-31), although the virus had been detected in white-tailed deer and moose in 2010 (Saxton-Shaw et al., 2015; VT Agency of Agriculture, Food and Markets, 2019b). One year after the emu outbreak, the first human cases of EEE in Vermont were reported in Rutland County, with two individuals having been infected (Saxton-Shaw et al., 2015). Positive samples of EEE in mosquitoes occurred in 2011, 2012, 2013, 2014, and 2015, but no more human cases in Vermont have been reported since 2012 (VT Agency of Agriculture, Food and Markets, 2019b).
Like WNV, EEE is transmitted by mosquitoes, which are very susceptible to changes in climatic conditions. Mosquitoes testing positive for EEE have been found mostly in pools located in acidic, hardwood swamps in Rutland and Addison counties; thus, they have been designated areas for future risk of EEE virus (VT Agency of Agriculture, Food and Markets, 2019b). Because of EEE infections in horses in Franklin County in 2013 and positive mosquito pools in 2014 and 2015, Franklin County is also being monitored for future risk (Figure 8-32) (VT Agency of Agriculture, Food and Markets, 2019b). Vermont itself has not yet been hit hard by EEE, but Massachusetts has reported the most cases of EEE in the Northeast (CDC, 2020c).

The symptoms of EEE often occur 4–10 days after the initial infection and can include fever, chills, myalgia, arthralgia, and malaise (CDC, 2021c; VT Agency of Agriculture, Food and Markets, 2019b). More serious, neurological infection symptoms include nausea, vomiting, headaches, fever, seizures, diarrhea, drowsiness, behavioral changes, and coma (CDC, 2021c; VT Agency of Agriculture, Food and Markets, 2019b). This more serious version of the disease can have long-lasting neurological effects. There is no specific treatment for EEE in humans; current treatment focuses on reducing symptoms and fever. In addition, approximately one-third of all people infected with EEE die from the disease (CDC, 2021c; VT Agency of Agriculture, Food and Markets, 2019b). People who engage in outdoor work and recreational activities in endemic areas are most vulnerable to contracting EEE. The individuals most vulnerable to developing EEE are individuals under the age of 15 and over the age of 50 (VT Dept. Health, 2019a).
Box 8.5: Eastern Equine Encephalitis (EEE)
In 2019, there were twenty cases and nine deaths of EEE in Massachusetts, Connecticut, and Rhode Island (Fastie, 2019). Despite this spike in cases in neighboring states, Vermont did not have a single case, nor were any positive mosquitoes identified in any of the 3,217 sites tested in the state. New Hampshire and New York also did not have any human cases, but EEE-positive mosquitoes were identified in both states (Fastie, 2019). While, like WNV, EEE is thought to be cyclical, it is unclear why Vermont avoided both human EEE cases and lack of EEE-positive mosquitoes.
8.6.3 Impact of Vector-Borne Diseases on Health
Increases in vector-borne illnesses in Vermont will burden the individuals affected and the health care system. As there has been an increase in emergency room visits from heat-related health issues, the increased incidence of vector-borne illnesses will likely put more strain on Vermont’s health-care system.
8.3.4 What You Can Do
This section explains how and what can be and is being done to address the changes in vector ecology in Vermont.
Ticks
The best way to prevent tick-borne diseases is to prevent tick bites. If you find a tick on your body, remove it quickly to reduce the risk of contracting Lyme disease. See a health care provider if you get sick or if you find a tick on you and are concerned about contracting Lyme. Lyme disease is treatable if caught early. Early diagnosis and treatment are important to avoid health problems related to Lyme disease (VT Dept. Health, 2019c).
Mosquitoes
The best way to prevent mosquito-borne illnesses is to prevent mosquito bites. Wearing long-sleeved garments and high socks and using sprays help prevent mosquito bites. In addition, avoid going outside during times when mosquitoes are most active: at dawn and dusk. Surveillance efforts in Vermont are informative about the prevalence of mosquitoes carrying diseases. The Vermont Department of Agriculture, Food, and Markets teamed up with other agencies in Vermont and tests thousands of mosquitoes every summer to understand trends of mosquito-borne illness prevalence in the state. The reports for each year since 2003 can be found on their website (VT Agency of Agriculture, Food and Markets, 2021a).
Box 8.6: One Health
The One Health concept recognizes that the health of humans is connected to the health of animals and the environment. One Health has been used worldwide to address spillover of zoonotic diseases to humans, antibiotic-resistant bacteria, and more. The CDC uses a One Health approach by working with physicians, ecologists, veterinarians, and others to monitor and control public health threats and learn how diseases spread across animal, plant, vector, and human spheres (CDC, 2020b).
State vector-borne disease prevention is an excellent opportunity to put a One Health approach into action. Vermont’s Department of Health and Agency of Agriculture are already involved with veterinarians, physicians, and ecologists to monitor and control Lyme, WNV, and EEE. This collaboration could be strengthened by including these actors when updating the next version of the Vermont Arbovirus Surveillance and Response Plan. Specifically, coordination with Department of Conservation ecological restoration projects could reduce mosquito habitat by accounting for farmers’ roles in reducing habitat and early detection of diseases and could increase accounting for climate change effects in future planning.
8.7 Water and Food
With contributions from Michael Mezzacapo
In this section, the general trends in changes to water and food in Vermont, how that impacts human health, and what can be done to protect water and food in the context of climate change is discussed.
8.7.1 Changes to Water and Food
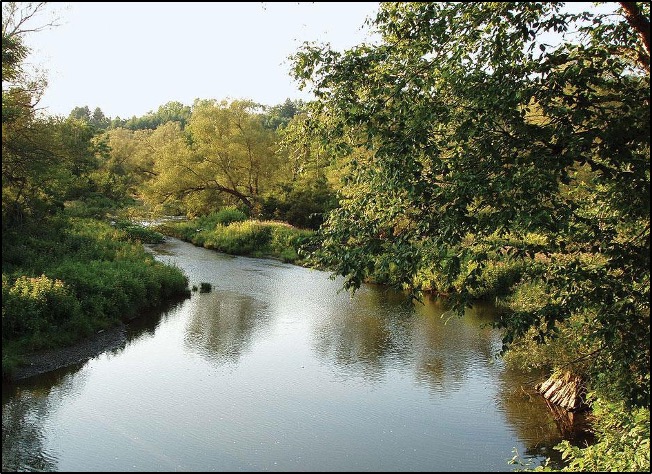
Measurable impacts from climate change already are altering the amount, timing, and quality of available water across the globe (Union of Concerned Scientists, 2010). Climate change and impacts to vital resources such as water are likely to negatively affect the four dimensions of food security—availability, access, utilization, and stability—and likely have a profound impact on human health (IPCC, 2019). Clean, adequate water access and healthy food supplies are essential to our well-being. Many view Vermont as a place with green pastures dotted with small farms nestled in rolling mountains and forest land for tree production and recreation (Figure 8-33). Working landscapes, including healthy farms and healthy forests, require proper stewardship and will need to be resilient in the face of a changing climate. Climate change will increase the negative impacts to both those that rely on natural resources for income and all citizens who choose to make Vermont their home.
Proper water supplies are needed to grow crops for animal production and feed growing human populations. Clean, sustainable water sources are not only needed for drinking, but also for irrigation and food preparation. Though Vermont exists in a humid climate, there are already impacts being felt from a changing climate. In 2018, during a severe drought around Franklin County, farmers had to haul water for livestock. USDA Environmental Quality Initiatives Program funding was made available for farmers to install new pipes and wells (Gribkoff, 2018). Though Vermont is getting wetter, climate change impacts the variability of dry and wet cycles.
Increased and sprawling residential and commercial development can place extreme pressures on wildlife, livestock, and crop production. More individual homes add to the number of onsite wastewater systems, which produce more nutrients and more chances to contaminate nearby water sources. Human health depends on a healthy environment. The state of Vermont is poised to face many challenges, as discussed in this Vermont Climate Assessment; however, basic survival and stability is predicated by access to clean water and the availability of healthy food. This section will briefly discuss how climate change can impact elements of water supplies, food production, and human health.
8.7.1.1 Water
Water distribution/quality
Climate change will continue to impact how precipitation is distributed around the state, though Vermont is getting wetter overall (see Physical Climate chapter). Extreme rainfall runoff causes soil erosion and flooding incidents, which impact water quality and can damage crops (USGS, 2021). Equally problematic are periods of extended drought, resulting in drinking water shortages and impacts to overall water quality in drinking and recreational waters (VT Dept. Health, 2017a). Drought periods followed by heavy rains can worsen pollution impacts because the soil is less absorbent, causing the rain to flow more easily off the surface (VT Dept. Health, 2017a). Stormwater runoff carries pollution such as fertilizers, toxins, sediment, animal wastes, wastewater, and other nutrient-rich materials quickly into rivers and lakes (VT DEC, 2018, 2021e). Human health is then compromised when these waters are used for recreation, drinking water, or irrigation of food crops.
Approximately 30% of the population in Vermont relies on a private drinking water source (VT Dept. Health, 2018b). These sources are not required to be tested regularly for contaminants, like nitrates. Both public and private drinking water wells can be subject to contamination from stormwater runoff (classified as nonpoint source pollution) (US EPA, 2015b). There is concern that excessive stormwater runoff from farms may be impacting nearby private drinking water wells. From 2007 to 2017, the Department of Agriculture tested 1,068 wells and found 63 private drinking water wells on or near farms that exceeded the state and federal drinking water standards for nitrate pollution, and 146 wells were at or over preventative action levels (Corwin, 2017).
Water-borne diseases/toxins
Many areas in Vermont have aging wastewater infrastructure and limited capital to invest in mitigation technologies, such as separated sewers, that can combat climate change impacts to these systems. Outdated wastewater systems can release sewage and stormwater into the environment after extreme rainfall events. Many drinking water sources in Vermont rely on surface water with these outfalls. The USGS estimates that in 2005, 440 million gallons of water were withdrawn every day in Vermont. Most withdrawals (88%) were from surface water sources, while the remaining (12%) were from groundwater sources (Medalie & Horn, 2010). As temperatures in Vermont increase, so will water temperatures. Warmer water temperatures will provide more favorable conditions for reproduction of waterborne pathogens and toxins (VT Dept. Health, 2017a). Several examples of impacts to human health are listed below.
E. coli is a specific type of bacteria that comes from fecal waste, including waste from humans, pets, livestock, birds, and wildlife (Lake Champlain Basin Program, 2021). Most types of E. coli are harmless, but certain strains can cause severe illness in humans, including diarrhea, stomach pain, nausea, and vomiting (Mayo Clinic, 2020). Exposure pathways include eating contaminated food, drinking untreated water, swimming near contaminated beaches, and contact with cattle or the feces of infected individuals (NY Dept. of Health, 2017). Because E. coli is ubiquitous in the environment, it can be difficult to understand future risks from E. coli. Recent research at the University of Guelph, Ontario, Canada concluded that climate change may trigger changes in bacteria to enable certain strains of E.coli to survive better in warmer soil and water conditions (van Elsas et al., 2011). As the climate warms in Vermont, environmental conditions could become more favorable for certain strains of E. coli to produce toxins and spread more easily, causing gastrointestinal illness and, in severe cases, death. In Vermont, E. coli presence in recreational water, such as Lake Champlain, is a common cause of beach closures. Closures typically occur after rainstorms flush sediment, bacteria, and pollutants into the lake (Figure 8-34) (Lake Champlain Basin Program, 2021). According to the Lake Champlain Basin Program, dog droppings are one of the leading causes of E. coli pollution. They offer suggestions on cleanup and how to keep dog feces from polluting the lake, including owners just picking it up where and when it happens.
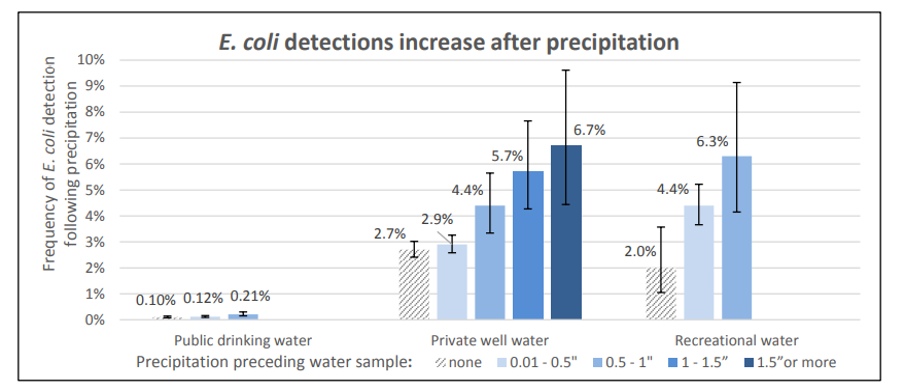
Note: Few samples were available for public drinking water and recreational water for precipitation over 1 inch. These samples were combined with those from the 0.5–1-inch category (Vermont Department of Health, 2017)
Legionnaires’ Disease: Legionella is a waterborne bacterium that can cause Legionnaires’ Disease. Those infected may develop pneumonia or Pontiac fever (VT Dept. Health, 2020). Legionella grows best in temperatures between 77°F–108°F (25°C–42°C) in stagnant water (CDC, 2021a). Legionnaires’ Disease spreads through aerosolization or aspiration of contaminated water in human-made building water systems (CDC, 2021a). Past outbreaks of Legionnaires’ disease were reported in Vermont in 1977 and 1980, and research shows that risk of developing Legionella increases when weather is warm and humid (Simmering et al., 2017). Vulnerable populations include those over fifty years old, which comprises about one-sixth of Vermont’s population.
Cyanobacteria blooms, also called algal blooms, are now a common sight on bodies of water in Vermont. Lake Champlain regularly experiences algal blooms, which often lead to beach closures and warnings about water quality. Cyanobacteria blooms occur when there are high levels of phosphorus and nitrogen in the water (VT Dept. Health, 2018e) This phosphorus and nitrogen tend to be higher after storms and heavy precipitation, when runoff from agricultural lands and other sources flows into the lake and deposits fertilizer. While most cyanobacteria are not harmful to human health, some carry toxins that can cause diarrhea, vomiting, rashes, sore throats, and runny noses. In addition, studies done on the particular toxins produced by cyanobacteria, called β-Methylamino-L-alanine (BMAAs), have shown a correlation between exposure to BMAA and neurodegenerative illnesses (Cox et al., 2018). The annual reports on cyanobacteria blooms make it challenging to assert whether these blooms are occurring more often (Figure 8-35) (Shambaugh, 2020). However, cyanobacteria are known to prefer warmer water temperatures, calm water, and nutrients like phosphorus and nitrogen (Lake Champlain Basin Program, 2018). Therefore, with warming temperatures in Vermont, and if nutrient runoff from farms and other sites continues, there could be an increase in blooms.
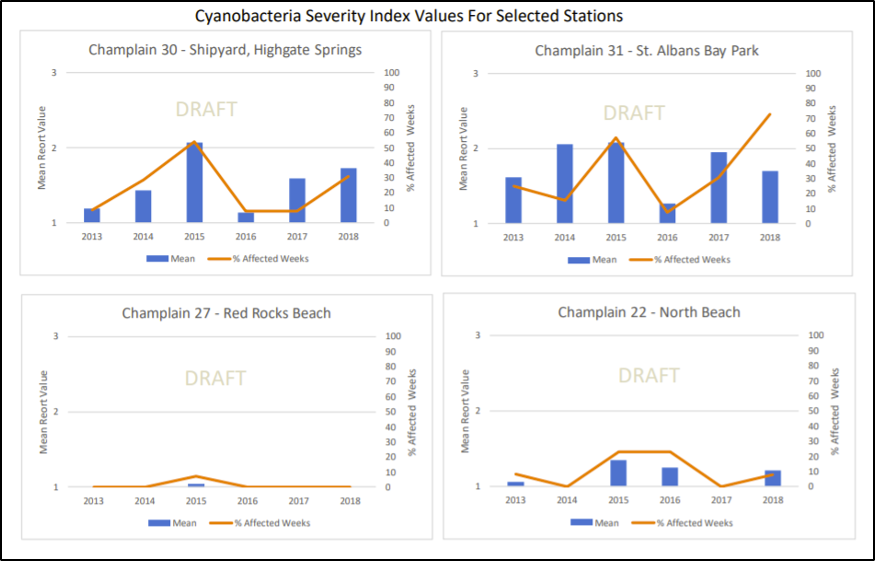
Mercury is a potent neurotoxin and dangerous to human and ecosystem health (Tang et al., 2020). There are several types of mercury. However, elemental mercury can be converted to methylmercury in the methylation process through microbial activity in aquatic environments and easily be ingested and stored by aquatic plants, fish, and wildlife. Higher water temperatures from climate change can allow for more mercury methylation, which increases the amount of mercury in fish and animals that consume the fish, including humans (Stager & Thill, 2010). Fishing is widely practiced in the state. According to a 2020 Department of Fish and Wildlife annual angler survey, about 72,000 resident anglers fished for almost 1.8 million days. Fish are a healthy source of protein and Omega-3 fatty acids (American Heart Association, 2017). Increases in mercury levels may trigger more fish consumption advisories across the state and impact the health of vulnerable populations, including pregnant or nursing women and children. Many factors can impact mercury levels in the environment, including changes to fish communities and extreme climatic events. Further study is needed to identify future scenarios to better protect human health (Swinton & Nierzwicki-Bauer, 2020). More studies in Vermont are needed to evaluate wild fish consumption patterns among Indigenous communities, such as the Abenaki who have a long-standing tradition of hunting and fishing in Vermont, and recreational anglers to better evaluate total fish intake and human health risks from mercury.
Box 8.7: Mercury in Lake Champlain Fish
Recent research discovered mercury levels in Lake Champlain fish increased in the period 2011–2017, whereas levels previously had been steadily decreasing (Swinton & Nierzwicki-Bauer, 2020). Several reasons cause the increase in mercury, including “atmospheric deposition, lake temperature, chlorophyll-a, fishery dynamics, lake flooding and loading of total suspended solids” (Swinton & Nierzwicki-Bauer, 2020). Because of the toxicity of mercury and previous problems with pollution from atmospheric sources, the State of Vermont has monitored levels of mercury in fish tissue since 1987 and detected measurable concentrations in 95% of the samples collected from both lakes and rivers (VT DEC, 2021c, 2021d).
8.7.1.2 Food
Food production/security
A warmer climate can have variable impacts on crop production. According to the World Bank, a 3.6°F (2°C) increase in temperature puts around 100–400 million people at risk of hunger worldwide (Clayton et al., 2017; Friel & Marmot, 2011; McMichael, 2013). Equally important is the amount of land available for agriculture. Recently, Vermont has seen a decrease in available farmland. According to a 2018 report by the University of Vermont Extension and the Vermont Housing & Conservation Board, Vermont lost the equivalent of three Camel’s Hump State Parks, roughly 64,000 acres total, in agricultural land between 1997 and 2012 (U. Vermont Extension & VT Housing & Conservation Board, 2018).
Aside from having favorable climatic conditions and available land to produce food, food production methods are important to food security and human health. Highly industrialized methods have cumulative effects on the environment, including contributing to climate change (Flesher, 2020). Future changes in Vermont’s climate, such as warming temperatures or increased precipitation, along with production practices like wide-scale chemical fertilizer or pesticide applications may increase human exposure and cause diseases such as non-Hodgkin lymphoma and leukemias (Bassil et al., 2007). Farmers may use more pesticides to control agricultural nuisances because warmer temperatures can cause insect metabolism to rise and weeds to outcompete food crops (Deutsch et al., 2018). These chemicals often make it into the environment or our food supplies. One such pesticide widely used in Vermont is atrazine. Atrazine is a “restricted-use” pesticide used to control grassy weeds (Agency for Toxic Substances and Disease Registry, 2003). Because of its classification, it must be applied by licensed applicators and has restrictions on how close it can be applied near bodies of water. Studies have indicated that atrazine is a known endocrine-disruptor and can impact reproductive health (Sass & Colangelo, 2006). Atrazine is also highly mobile in the environment and can easily enter water, where it takes a long time to break down (Donley, 2019).
Box 8.8: Food Insecurity
In 2020, researchers at the University of Vermont conducted surveys to assess food insecurity. The results surprised researchers. Insecurity rose from 18.3% to 24.3% during the COVID-19 pandemic, or to nearly one in four Vermonters (Niles et al., 2021). This is nearly triple the levels of 2018. Respondents adopted coping strategies to address food access challenges, including buying foods that had a longer shelf life (77%), cheaper foods (66%), and even eating less (66%) (Niles et al., 2021). Food insecurity is compounded by other factors, including economic impacts or disease outbreaks, as witnessed in 2020-2021.
Climate change impacts can also disrupt food access by reducing production. Research shows that cold-weather crop production may be the most at risk from rising temperatures (US Global Change Research Program, 2010). Items such as field corn, wheat, and oats don’t produce well when summer temperatures increase. This is even though the growing season may be six to eight weeks longer in 2067 (Ready-Campbell, 2017). Even warm weather crops like tomatoes and peppers can be severely impacted if temperatures exceed 90°F during certain parts of their life cycle (Dunnington, 2010; Frumhoff et al., 2008). Food insecurity has many negative associations with human health, including increased risks of some birth defects, anemia, lower nutrient intakes, cognitive problems, aggression, and anxiety (Gundersen & Ziliak, 2015).
The amount of food grown in Vermont may be reduced by climate change. For example, higher temperatures create small reductions in milk production in cows (Pragna et al., 2016). Even if citizens have adequate access to food, research has shown that nutritional values of the food can be impacted by rising CO2 and temperatures (Myers et al., 2014; M. R. Smith & Myers, 2018). For instance, higher CO2 concentrations lower the levels of protein and essential minerals of staple crops such as wheat, rice, and potatoes (Ziska et al., 2016). With lower levels of nutrients, people may be unable to meet their required intake of healthy food, and those who are already food insecure may be hit hardest. Lack of proper nutrition leads to many health issues, including diabetes, scurvy, anemia, general malnutrition, and developmental problems in children.
Food-borne Illness
Increased air temperatures provide more opportunity for dangerous pathogens to spread on crops and in food production. Additionally, warmer temperatures experienced in winter may also reduce the typical winter kill of pathogens (VT Dept. Health, 2017a).
8.7.2 Impact on health
As mentioned above, many other water quality-related health issues can arise including diarrhea, vomiting, liver damage, nerve damage, etc., depending on the issues in water. One example discussed in depth in this chapter is mercury. Mercury is a potent neurotoxin that can easily cross the blood-brain and placental barriers (VT DEC, 2021c). Impacts from mercury exposure include damage to the brain and kidneys, and impacts can be especially problematic in the fetus, children, and pregnant and nursing mothers (US EPA, 2015a). Mercury exposure can display severe, subtle, or no symptoms, depending on the form, amount, and length of exposure to the mercury consumed, and the current health of the individual (US EPA, 2015a). Exposed children may display differences in cognitive abilities, attention, language, fine motor skills, and visual spatial skills (US EPA, 2015a). Methylmercury poisoning (the most common type from consumption of fish) symptoms in adults may include (US EPA, 2015a):
- Loss of peripheral vision.
- “Pins and needles” feelings, usually in the hands, feet, and around the mouth.
- Lack of coordination of movements.
- Impairment of speech, hearing, walking; and/or
- Muscle weakness.
Other food- and waterborne illnesses in Vermont include salmonella, campylobacteriosis, cryptosporidiosis, hepatitis A, shigellosis, and norovirus. A full description of all these illnesses can be found on the Vermont Department of Health’s Climate Change and Food and Waterborne Illnesses page (VT Dept. Health, 2016d).
8.7.3 What You Can Do
The Lake Champlain Committee (LCC) involves citizen scientists to monitor and report cyanobacteria blooms. This information is then used to update weekly the Cyanobacteria Tracker Map, which is managed by the Vermont Departments of Health and of Environmental Conservation (VT DEC, 2021f). Volunteering with the LCC can increase your awareness of the activities being done to monitor water quality, fix lakeside infrastructure, and generally clean up Lake Champlain.
Keeping current on beach closings or water advisories can help prevent exposure to toxins and bacteria when levels are unsafe. In addition, anglers who enjoy eating the caught fish should follow the Vermont Department of Conservation’s advice on mercury levels in fish, which can be helpful in determining your potential exposure to mercury (Figure 8-36).
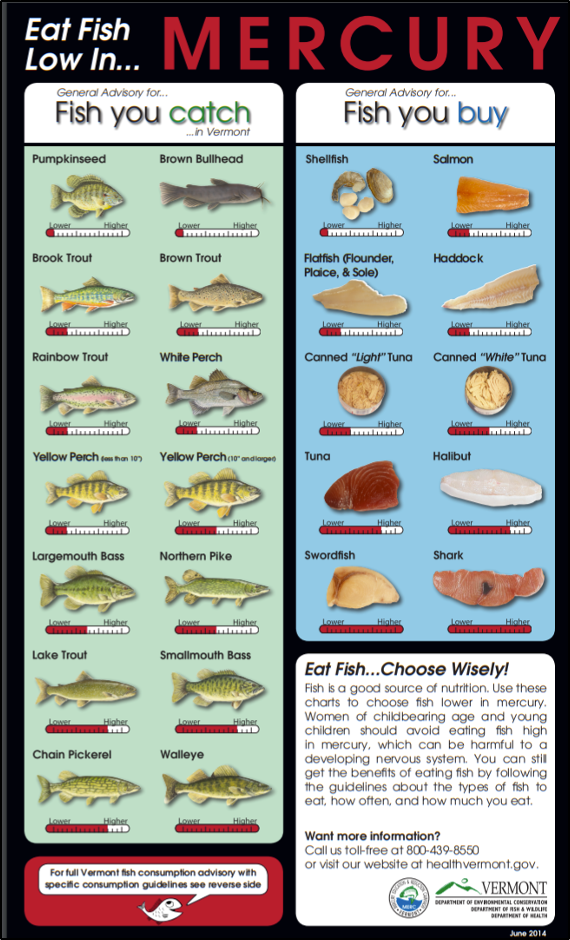
Supporting local farms that practice regenerative or conservation tillage agriculture or that are transitioning to those agricultural practices can help to reduce the amount of fertilizer and runoff from those farms into water bodies. Following guidelines from the Vermont Low Impact Development Guide can help reduce the water quality impacts of new construction (VT DEC, 2010).
8.8 Mental Health
“Climate change is a human-caused problem, which is more difficult to cope with [mentally] than disasters that are beyond human control,” says Thomas Doherty, PsyD, in a comprehensive report by the American Psychological Association, Climate for Health, and ecoAmerica on the impacts of climate change on mental health (Clayton et al., 2017). This report was written because most of the literature on climate change and health addresses the physical health impacts primarily and mental health impacts secondarily (Clayton et al., 2017). However, more and more there are clear links between changes to the climate and environment and mental health. This section outlines changes being observed in mental health, including climate-induced anxiety and suggests some ways to address these issues.
8.7.3 Changes in mental health
Well-being is intricately linked to the environment. Climate change has brought changes to mental well-being, both directly (e.g., through natural disasters like floods and storms) and indirectly (e.g., weakened and unstable infrastructure, rising sea levels, and forced migration) (Berry et al., 2010; Clayton et al., 2017; Schlanger, 2017). Impacts include increased anxiety, depression, shock, post-traumatic stress disorder (PTSD), compounded or chronic stress, and substance abuse (Figure 8-37). Other changes to mental health and behavior related to climate change include increased aggression and violence, increased senses of fatalism and hopelessness, and more mental health emergencies (Clayton et al., 2017; Schlanger, 2017). Luckily, the dialogue around climate change’s impact on mental health has become more common in the past few years, which has led to new terms such as “eco-anxiety” to describe the fear, existential angst, and emotions surrounding climate change (Schlanger, 2017).
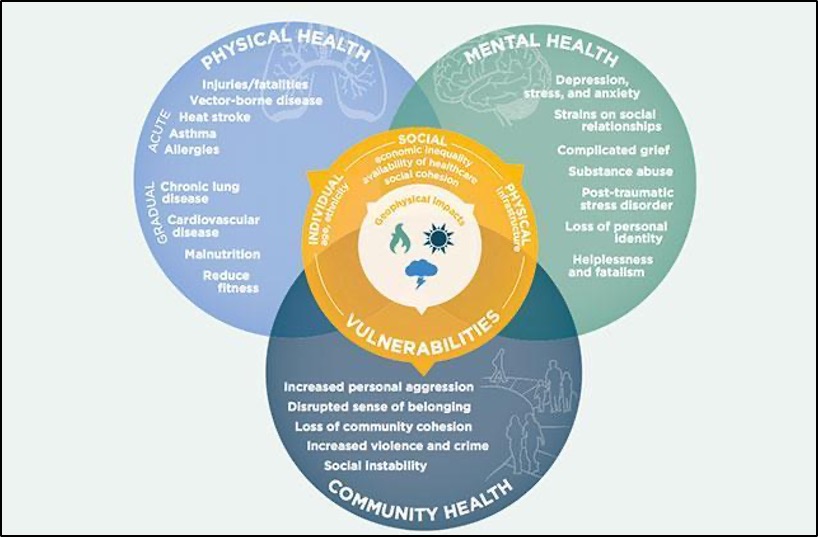
It can be difficult to grasp the connection between climate and health. Measures like maintaining a psychological distance, creating a political divide, and denial of the problem influence the way that people are able or unable to comprehend climate change. However, connecting climate change and personal health often increases the chances that individuals will take part in or support climate solutions, which, in turn, promotes psychological health (Figure 8-38) (Clayton et al., 2017). This is a center point of ecopsychology, a relatively new field that explores relationships between physical and mental health and the health of the environment. There are more and more studies that promote the interaction of people with their environment for physical and cognitive well-being (Robbins, 2020). Engaging with nature is “an antidote to stress: It can lower blood pressure and stress hormone levels, reduce nervous system arousal, enhance immune system function, increase self-esteem, reduce anxiety, and improve mood” (Robbins, 2020). Several organizations in Vermont use this idea of engaging with nature to promote healing and mental health through wilderness therapy, which is using extended time in nature combined with clinical therapeutics to promote well-being.
| Barriers | Solutions |
|---|---|
| Climate change is often perceived as global, distant, and difficult to understand. | Learning and experiencing the local effects of climate change make the problem more tangible and a reality. |
| Political affiliation drives a wedge in the public’s awareness of and beliefs about climate change. | Talking about the health impacts of climate change resonates across the political spectrum. |
| The complexity and a fear of climate change drive people to feel uncertain and in denial. | Connecting climate impacts to practical solutions encourages action while building emotional resiliency. |
Other, larger-scale changes can disrupt mental health, such as changes to businesses and hobbies due to storms and other disasters (VT Dept. Health, 2018a). Says Linda Silka, PhD, “New England is an example of vital infrastructure that is at risk from rising sea levels and of opportunities for psychologists to work with professionals in various fields to prepare for the effects” (Clayton et al., 2017). While Dr. Silka is speaking specifically of sea level rise, the sentiment of her statement can be applied to any impending disasters or climatic changes. Financial stress and changes to ways of life can be distressing and difficult to cope with, and we are likely to see these kinds of stresses arise with impending changes to Vermont’s climate. For instance, the ski industry provides economic benefit and a way of life for many Vermonters and other folks from out of state (see Recreation chapter). With increasing winter temperatures, changes to snowpack could change the status quo for this industry and for those who derive enjoyment from it and could thus lead to increased personal and financial stress and anxiety.
With changes to vector ecology, air quality, and temperatures also come changes to physical health. Those affected by health issues like Lyme disease and asthma also tend to have increased burdens of depression or anxiety related to their condition (Asthma UK, 2020; Garakani & Mitton, 2015). With potential increases in both Lyme disease and asthma in Vermont, there may well also be a spike in mental health issues.
Box 8.9: Mental Health Access for Kids
The COVID-19 pandemic has thrown into relief the need for increased mental health infrastructure and access for children under the age of eighteen. Generally, there is an increase in demand for mental health care during the spring semester of the school year, and with social isolation and “skyrocketing anxiety” from the pandemic, demand for mental health care has grown even more. A decrease in available inpatient beds during the pandemic led to individuals waiting in emergency departments for hours. There is a seven-month waitlist to see a child psychiatrist at the University of Vermont Medical Center. If nothing else, the pandemic—like Tropical Storm Irene—has highlighted the need for improved mental health infrastructure and care, especially for children.
An experimental model called Pediatric Urgent Care for Kids has reduced the amount of youth ED visits by 33%. Launched in 2018 by United Counseling Service and Southwestern Medical Center in Bennington, this could be a model for the rest of the state to follow (Jickling, 2021).
Economically disadvantaged populations, those living with chronic diseases or pre-existing disabilities, and those living in unequal socioeconomic, geographic, and demographic locations tend to be particularly vulnerable to mental health issues (Clayton et al., 2017). Areas of increased vulnerability can be seen in the Vermont Department of Health’s Social Vulnerability Index map (Figure 8-39). It would be beneficial to update the data to see if/how the social vulnerability index has changed since 2015, but this tool is useful to predict potential areas where mental health resilience may be lower. Because lower socioeconomic status often positively correlates with increased mental health issues, understanding what parts of Vermont are particularly vulnerable in terms of economics, demographics, and more, can indicate where there might be more issues with mental health, and thus where the state can allocate its resources (Hudson, 2005; Reiss et al., 2019).
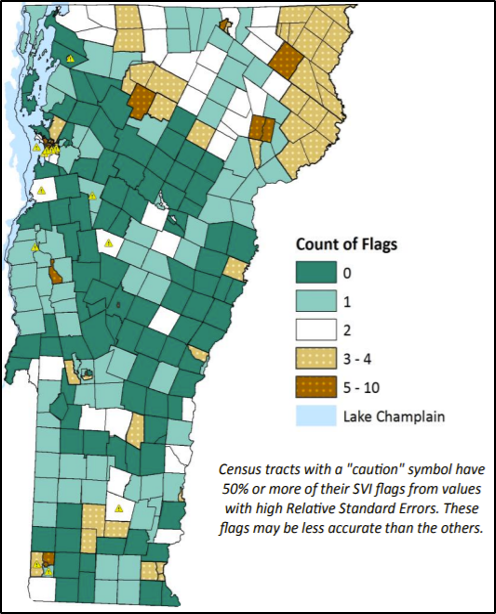
As mentioned previously, Vermonters experienced long-term mental health impacts from Tropical Storm Irene. The storm necessitated the formation of short-term crisis intervention teams and a restructuring of the state’s mental health treatment facilities. A study conducted in Rochester, Vermont in 2014 found that 42% of the participants who reported negative emotions immediately after the storm also reported lasting negative emotions three years after the storm (Buschman et al., 2014). The individuals in the study that mentioned community involvement as part of their response and recovery from Irene tended to have a more positive emotional response and recovery to the storm (Buschman et al., 2014). This finding is a testament to the importance of community in mental health and resilience.
8.8.2 What You Can Do
Certain actions can improve mental well-being in the face of climate change. The previously mentioned comprehensive report on climate change and mental health makes several recommendations for individuals, communities, and mental health practitioners.
Individuals
Caring for the health of communities often starts with taking care of personal mental health and well-being: the overall well-being and resilience of communities depend on “the individuals within the community and how they react both as individuals and as a collective” (Clement, 2020). Four practical steps to improve individual resilience and mental health from the previously mentioned APA report include:
“1) Make and practice household emergency plans.
2) Participate in mindset training to prepare for adversity and adaptation through increased awareness of our emotions.
3) Care for oneself through healthy habits.
4) Connect with family, friends, neighbors, and other groups to build strong social networks.”
(Clayton et al., 2017)
Communities
Communities and community health play a vital role in promoting the mental health of the individuals within the community. Five ways communities can foster a positive environment for well-being are:
“1. Assess and expand community mental health infrastructure.
2. Reduce disparities and pay attention to populations of concern.
3. Engage and train community members on how to respond.
4. Ensure distribution of resources and augment with external supplies.
5. Have clear and frequent climate–mental health communication.”
(Clayton et al., 2017)
Communities can also promote the use of public transport, which “invigorates community mental health” and increases community cohesion, promotes neighborhood walkability, and reduces depression and stress symptoms (Clayton et al., 2017). Promoting physical commuting (i.e., walking and biking) also decreases stress and depression symptoms (Clayton et al., 2017). In addition, the intentional use of green spaces promotes mental well-being, and clean energy can reduce health burdens by reducing the amount of particle pollution in the air (Clayton et al., 2017). By encouraging and implementing these strategies, communities can foster an environment to promote positive mental health and well-being.
Mental Health Professionals and Practitioners
The aforementioned report discusses ways for professional or mental health practitioners to support both communities and individuals. For communities, mental health professionals can:
“1) Become a mental health-related climate-literate professional.
2) Engage fellow public and mental health professionals.
3) Be vocal, model leaders within your communities.
4) Support national and international climate–mental health solutions.”
(Clayton et al., 2017)
Similarly, professionals can also help individuals to:
“1. Build belief in one’s own resilience.
2. Foster optimism.
3. Cultivate active coping and self-regulation skills.
4. Maintain practices that help to provide a sense of meaning.
5. Promote connectedness to family, place, culture, and community.”
(Clayton et al., 2017)
There are many ways to foster a positive environment for promoting well-being and good mental health. While many of the above-mentioned recommendations are specific to climate-related mental health, they may also contribute to creating an inclusive and resilient community made up of engaged and resilient individuals. By working off this as a baseline, there is an increased ability for individuals and communities to have the tools and abilities to cope with climate change.
8.9 Traceable Accounts
Traceable accounts describe the confidence level—the degree of certainty in the scientific evidence—for each key message resulting from this chapter. This analysis is based on the U.S. Global Change Research Program guidance in the Fourth National Climate Assessment (Reidmiller et al. 2018).
Confidence Level
- Very High – Strong evidence (established theory, multiple sources, confident results, well-documented and accepted methods, etc.), high consensus
- High – Moderate evidence (several courses, some consistency, methods vary, and/or documentation limited, etc.), medium consensus
- Medium – Suggestive evidence (a few sources, limited consistency, models incomplete, methods emerging, etc.), competing schools of thought
- Low – Inconclusive evidence (limited sources, extrapolations, inconsistent findings, poor documentation and/or methods not tested, etc.), disagreement or lack of opinions among experts
Key Message 1
Climate change affects human health by exacerbating existing health problems and amplifying conditions for new health problems.
- Confidence level: Very High
- Description: High consensus; multiple evidence bases; lots of documentation
- References: VCA, 2014; IPCC, 2021; National Climate Assessment, 2018
Key Message 2
Individuals who are children, over 65 years, of low socioeconomic status, Indigenous, or have previous health issues are more vulnerable to the health effects of climate change.
- Confidence level: Very High
- Description: High consensus; multiple studies and evidence; lots of documentation
- References: National Climate Assessment, 2018; IPCC 2021; Vermont Health Department
Key Message 3
Warmer and more moist temperatures in Vermont are likely to create more habitat for disease-carrying ticks and mosquitoes.
- Confidence level: High
- Description: Climate models have general consensus on warming trends; some studies done on vector and disease migration
- References: Allen et al., 2019; Vermont Department of Health
Key Message 4
Increases in the number and severity of natural disasters in Vermont will likely increase the risk of injury, illness, and death.
- Confidence level: Very High
- Description: Much consensus on causal relationship between increased severity of storms and impact on health; lots of data
- References: Fourth National Climate Assessment, 2018; Smith et al., 2014; FEMA.gov, 2021
Key Message 5
Climate change could affect the quality and safety of food and water, which could lead to increases in food and water-borne illnesses.
- Confidence level: High
- Description: High level of confidence in causal relationship between water and food changes and related illnesses
- References: Union of Concerned Scientists, 2010; IPCC, 2019; State of Vermont, 2021
Key Message 6
Decreases in air quality will exacerbate existing chronic diseases and decrease water quality.
- Confidence level: Very High
- Description: High consensus on air quality and chronic lung diseases; multiple studies done
- References: Dean & Green, 2018; Smith et al., 2014; American Lung Association, 2020; Vermont Department of Health, 2019
Key Message 7
Mental health is inextricably linked with environmental health. Impacts from climate change could contribute to mental health challenges.
- Confidence level: Very High
- Description: High consensus on environment and mental health; multiple studies done; increasing documentation
- References: Berry et al., 2010; Clayton et al., 2017; Schlanger, 2017; Robbins, 2020
8.10 Acknowledgements
This chapter is the product of many different people, all of whom played important roles in bringing it to the finish line. First, I would like to thank Dan Quinlan without whom I would never have learned of the Vermont Climate Assessment, and who provided essential feedback and resources to enhance the chapter. Thanks for your continued commitment to climate and health, Dan. Second, thank you to Gillian Galford, who spearheaded this whole project and brought me onto the team. Additional big thanks goes to Christine Vatovec and Jared Ulmer, who provided timely and detailed feedback on the contents of this chapter, and who contribute greatly to research and communication around climate change and human health. Thanks to the VCA team, who were supportive and provided feedback and different perspectives for the chapter, and to Michael Mezzacapo for taking on a part of the Food and Water section of this chapter. Finally, a huge thank you to my friends and family who listened to my ramblings about climate change and human health and provided insight, support, and feedback when needed.
8.11 References
Achakulwisut, P., Brauer, M., Hystad, P., & Anenberg, S. C. (2019). Global, national, and urban burdens of paediatric asthma incidence attributable to ambient NO2 pollution: Estimates from global datasets. The Lancet Planetary Health, 3(4), e166–e178. https://doi.org/10.1016/S2542-5196(19)30046-4
Agency for Toxic Substances and Disease Registry. (2003). Atrazine (CAS No. 1912-24–9; p. 6). CDC. https://www.atsdr.cdc.gov/toxprofiles/tp153-c1-b.pdf
Aikman, C. (2012, February 27). Starting Over Strong Vermont: Building resilience through community events. VTDigger. https://vtdigger.org/2012/02/27/starting-over-strong-vermont-building-resilience-through-community-events/
Allen, D., Borgmann-Winter, B., Bashor, L., & Ward, J. (2019). The Density of the Lyme Disease Vector Ixodes scapularis (Blacklegged Tick) Differs between the Champlain Valley and Green Mountains, Vermont. Northeastern Naturalist, 26(3), 545. https://doi.org/10.1656/045.026.0307
American Heart Association. (2017). Fish and Omega-3 Fatty Acids. Eat Smart. https://www.heart.org/en/healthy-living/healthy-eating/eat-smart/fats/fish-and-omega-3-fatty-acids
American Lung Association. (2021). State of the Air. State of the Air. https://www.stateoftheair.org/
American Society of Civil Engineers Vermont Section. (2019). Report Card for Vermont’s Infrastructure. https://infrastructurereportcard.org/vermont/
Associated Press. (2015). Top states for residential wood burning, by emissions. Federal News Network. https://federalnewsnetwork.com/health-news/2015/03/top-states-for-residential-wood-burning-by-emissions/
Asthma U. K. (2020). Wellbeing for people with severe asthma. Mental Health and Severe Asthma. https://www.asthma.org.uk/advice/severe-asthma/making-life-easier-with-severe-asthma/mental-health-severe-asthma/
Bassil, K. L., Vakil, C., Sanborn, M., Cole, D. C., Kaur, J. S., & Kerr, K. J. (2007). Cancer health effects of pesticides: Systematic review. Canadian Family Physician, 53(10), 1705–1711.
Berry, H., Bowen, K., & Kjellstrom, T. (2010). Climate change and mental health: A causal pathways framework. International Journal of Public Health, 55, 123–132. https://doi.org/10.1007/s00038-009-0112-0
Britannica. (2011). Winooski River. https://www.britannica.com/place/Winooski-River
Britannica. (2020). Air Pollution: Effects, Causes, Definition, & Facts. Air Pollution. https://www.britannica.com/science/air-pollution
Bureau of Transportation Statistics. (2017). Vermont: Transportation by the numbers (p. 2). US Dept. of Transportation, Bureau of Transportation Statistics. https://www.bts.dot.gov/sites/bts.dot.gov/files/legacy/Vermont.pdf
Buschman, V., Fernandes, C., Guth, S., Mullen, A., & Rosales-Underbrink, P. (2014). Tropical Storm Irene: A Retrospective on Mental and Emotional Impacts on Vermont Communities, Three Years Later [Environmental Studies Senior Capstone, Middlebury College]. http://www.middlebury.edu/media/view/490671/original/dm_irenerochester_final_dec152014_no_names.pdf
Campbell-Lendrum, D., & Prüss-Ustün, A. (2019). Climate change, air pollution and noncommunicable diseases. Bulletin of the World Health Organization, 97(2), 160–161. https://doi.org/10.2471/BLT.18.224295
Case, M. J., & Stinson, K. A. (2018). Climate change impacts on the distribution of the allergenic plant, common ragweed (Ambrosia artemisiifolia) in the eastern United States. PLOS ONE, 13(10), e0205677. https://doi.org/10.1371/journal.pone.0205677
CDC. (2018). Tickborne Diseases of the United States: A Reference Manual for Health Care Providers (5th ed.). U.S. Department of Health and Human Services, Centers for Disease Control and Prevention. https://www.cdc.gov/ticks/tickbornediseases/TickborneDiseases-P.pdf
CDC. (2020a, June 3). West Nile virus. https://www.cdc.gov/westnile/index.html
CDC. (2020b, October 15). One Health Basics. One Health. https://www.cdc.gov/onehealth/basics/index.html
CDC. (2020c, November 18). Eastern Equine Encephalitis (Statistics & Maps). Statistics & Maps. https://www.cdc.gov/easternequineencephalitis/tech/epi.html
CDC. (2021a). Legionnaires Disease Cause and Spread. Legionella (Legionnaires’ Disease and Pontiac Fever). https://www.cdc.gov/legionella/about/causes-transmission.html
CDC. (2021b, May 13). People with certain medical conditions. COVID-19. https://www.cdc.gov/coronavirus/2019-ncov/need-extra-precautions/people-with-medical-conditions.html
CDC. (2021c, August 9). Eastern Equine Encephalitis. https://www.cdc.gov/easternequineencephalitis/index.html
Clayton, S., Manning, C., College, M., Krygsman, K., Speiser, M., Cunsolo, A., Derr, V., Doherty, T., Fery, P., Haase, E., Kotcher, J., Silka, L., & Tabola, J. (2017). Mental health and our changing climate: Impacts, implications, and guidance (p. 70). American Psychological Association and ecoAmerica.
Clement, S. (2020). “COVID-19’s Impact on Climate Change Research and Institutional Resilience in Higher Education in Vermont and Tanzania”. Capstone Collection. 3225. https://digitalcollections.sit.edu/capstones/3225
Corwin, E. (2017, December 15). When Farm Runoff Threatens Well Water, The State’s Response Is Lacking. In Vermont Public Radio. https://www.vpr.org/vpr-news/2017-12-15/when-farm-runoff-threatens-well-water-the-states-response-is-lacking
Cox, P. A., Kostrzewa, R. M., & Guillemin, G. J. (2018). BMAA and Neurodegenerative Illness. Neurotoxicity Research, 33(1), 178–183. https://doi.org/10.1007/s12640-017-9753-6
Darrow, L. A., Hess, J., Rogers, C. A., Tolbert, P. E., Klein, M., & Sarnat, S. E. (2012). Ambient pollen concentrations and emergency department visits for asthma and wheeze. Journal of Allergy and Clinical Immunology, 130(3), 630-638.
Dean, A., & Green, D. (2018). Climate change, air pollution and human health in Sydney, Australia: A review of the literature. Environ. Res. Lett., 16.
Department of Environmental Conservation. (2021). Data Summary Graphs [State of Vermont]. Air Quality Monitoring. https://dec.vermont.gov/air-quality/monitoring/data-summary-graphs
Deutsch, C. A., Tewksbury, J. J., Tigchelaar, M., Battisti, D. S., Merrill, S. C., Huey, R. B., & Naylor, R. L. (2018). Increase in crop losses to insect pests in a warming climate. Science (New York, N.Y.), 361(6405), 916–919. https://doi.org/10.1126/science.aat3466
Donley, N. (2019). The USA lags behind other agricultural nations in banning harmful pesticides. Environmental Health, 18(1), 44. https://doi.org/10.1186/s12940-019-0488-0
Drive Electric Vermont. (2021). Purchase Incentives. https://www.driveelectricvt.com/why-go-electric/purchase-incentives
Dumic, I., & Severnini, E. (2018). “Ticking Bomb”: The Impact of Climate Change on the Incidence of Lyme Disease. Canadian Journal of Infectious Diseases and Medical Microbiology, 2018, e5719081. https://doi.org/10.1155/2018/5719081
Dunnington, G. (2010). The Potential Impacts of Climate Change on Agriculture in Vermont (Climate Change Adaptation White Paper Series, p. 6). VT Agency of Natural Resources. https://climatechange.vermont.gov/sites/climate/files/documents/Data/VTCCAdaptAgriculture.pdf
Ebi, K. L., & Mills, D. (2013). Winter mortality in a warming climate: A reassessment. WIREs Climate Change, 4(3), 203–212. https://doi.org/10.1002/wcc.211
Edling, L., & Danks, C. (2021). Supporting actors: The role of state policy and private programs in advancing local and renewable heating technology. Energy Policy, 153, 112266. https://doi.org/10.1016/j.enpol.2021.112266
Fastie, C. (2019). Vermont avoids New England’s big year for EEE. Moosalamoo Woods & Waters. http://mwwvt.org/arbo/2019-eee/
FEMA. (2021). Declared Disasters. Disasters & Assistance. https://www.fema.gov/disasters/disaster-declarations?field_dv2_state_territory_tribal_value=VT&field_year_value=All&field_dv2_declaration_type_value=DR&field_dv2_incident_type_target_id_selective=All&page=0
Flesher, J. (2020, February 6). Factory farms provide abundant food, but environment suffers. PBS NewsHour. https://www.pbs.org/newshour/economy/factory-farms-provide-abundant-food-but-environment-suffers
French, E. (2020, September 17). Hazy Vermont skies a result of West Coast fires; now, the haze is moving out. VTDigger. https://vtdigger.org/2020/09/17/hazy-vermont-skies-a-result-of-west-coast-fires-now-the-haze-is-moving-out/
Friel, S., & Marmot, M. G. (2011). Action on the Social Determinants of Health and Health Inequities Goes Global. Annual Review of Public Health, 32(1), 225–236. https://doi.org/10.1146/annurev-publhealth-031210-101220
Frumhoff, P. C., McCarthy, J. J., Melillo, J. M., Moser, S. C., Wuebbles, D. J., Wake, C., & Spanger-Siegfried, E. (2008). An integrated climate change assessment for the Northeast United States. Mitigation and Adaptation Strategies for Global Change, 13(5–6), 419–423. https://doi.org/10.1007/s11027-007-9138-x
Galford, G., Hoogenboom, Ann, Carlson, Sam, Ford, Sarah, Nash, Julie, Palchak, Elizabeth, Pears, Sarah, Underwood, Kristin, & Baker, Daniel V. (2014). Considering Vermont’s Future in a Changing Climate: The First Vermont Climate Assessment (p. 219). Gund Institute for Ecological Economics.
Garakani, A., & Mitton, A. G. (2015). New-Onset Panic, Depression with Suicidal Thoughts, and Somatic Symptoms in a Patient with a History of Lyme Disease. Case Reports in Psychiatry, 2015. https://doi.org/10.1155/2015/457947
Githeko, A. K., Lindsay, S. W., Confalonieri, U. E., & Patz, J. A. (2000). Climate change and vector-borne diseases: A regional analysis. Bulletin of the World Health Organization, 12.
Gribkoff, E. (2018, October 11). Drought continues to plague northern Vermont, leaving farms and wells dry. VTDigger. https://vtdigger.org/2018/10/11/drought-continues-plague-northern-vermont-leaving-farms-wells-dry/
Gundersen, C., & Ziliak, J. P. (2015). Food Insecurity and Health Outcomes. Health Affairs (Project Hope), 34(11), 1830–1839. https://doi.org/10.1377/hlthaff.2015.0645
Hewitt, E. (2016, August 25). Five years after Irene, Vermont has rebuilt, but marks remain. VTDigger. https://vtdigger.org/2016/08/25/five-years-after-irene-vermont-has-rebuilt-but-marks-remain/
Hudson, C. G. (2005). Socioeconomic Status and Mental Illness: Tests of the Social Causation and Selection Hypotheses. American Journal of Orthopsychiatry, 75(1), 3–18. https://doi.org/10.1037/0002-9432.75.1.3
Inside Climate News. (2016, September 1). Five Years After Hurricane Irene, Vermont Still Striving for Resilience. Inside Climate News. https://insideclimatenews.org/news/01092016/five-years-after-hurricane-irene-2011-effects-flooding-vermont-damage-resilience-climate-change/
IPCC. (2019). Climate Change and Land: An IPCC special report on climate change, desertification, land degradation, sustainable land management, food security and greenhouse gas fluxes in terrestrial ecosystems (p. 874) [IPCC Special Report]. International Panel on Climate Change. https://www.ipcc.ch/site/assets/uploads/2019/11/SRCCL-Full-Report-Compiled-191128.pdf
Jickling, K. (2021, April 27). ‘A crisis’: Kids seeking mental health care are waiting for days in emergency rooms—VTDigger. VT Digger. https://vtdigger.org/2021/04/27/a-crisis-kids-seeking-mental-health-care-are-waiting-for-days-in-emergency-rooms/
Kilpatrick, A. M., Kramer, L. D., Campbell, S. R., Alleyne, E. O., Dobson, A. P., & Daszak, P. (2005). West Nile Virus Risk Assessment and the Bridge Vector Paradigm. Emerging Infectious Diseases, 11(3), 425–429. https://doi.org/10.3201/eid1103.040364
King, M. (2015, January 8). Vermont Asthma Rates Among the Highest in the U.S. UVM Outreach. https://learn.uvm.edu/blog/blog-health/asthma-rates-in-vermont
Kovats, R. S., & Hajat, S. (2008). Heat Stress and Public Health: A Critical Review. Annual Review of Public Health, 29(1), 41–55. https://doi.org/10.1146/annurev.publhealth.29.020907.090843
Lancet Countdown on Health and Climate Change. (2020). https://www.thelancet.com/countdown-health-climate
Lake Champlain Basin Program. (2018). 2018 State of the Lake and Ecosystem Indicators Report. https://sol.lcbp.org/en/
Lake Champlain Basin Program. (2021). Swimming. Fishable, Swimmable, Drinkable. https://www.lcbp.org/our-goals/clean-water/fishable-swimmable-drinkable/swimming-2/
Ludwig, A., Zheng, H., Vrbova, L., Drebot, M., Iranpour, M., & Lindsay, L. (2019). Increased risk of endemic mosquito-borne diseases in Canada due to climate change. Canada Communicable Disease Report, 45(4), 91–97. https://doi.org/10.14745/ccdr.v45i04a03
Mayo Clinic. (2020). E. coli—Symptoms and causes. E. Coli. https://www.mayoclinic.org/diseases-conditions/e-coli/symptoms-causes/syc-20372058
McMichael, A. J. (2013). Globalization, Climate Change, and Human Health. New England Journal of Medicine, 368(14), 1335–1343. https://doi.org/10.1056/NEJMra1109341
Medalie, L., & Horn, M. A. (2010). Estimated Water Withdrawals and Return Flows in Vermont in 2005 and 2020 (No. 2010–5053; U.S. Geological Survey Scientific Investigations Report, p. 62). https://pubs.usgs.gov/sir/2010/5053/pdf/sir2010-5053.pdf
Melillo, J. M., Richmond, T. (T. C.), & Yohe, G. W. (2014). Climate Change Impacts in the United States: The Third National Climate Assessment. U.S. Global Change Research Program. https://doi.org/10.7930/J0Z31WJ2
Mingle, J. (2019, November 26). Vermont Doubles Down on Wood Burning, with Consequences for Climate and Health. Inside Climate News. https://insideclimatenews.org/news/26112019/wood-burning-climate-health-consequences-vermont-forest-energy-plan/
Myers, S. S., Zanobetti, A., Kloog, I., Huybers, P., Leakey, A. D. B., Bloom, A. J., Carlisle, E., Dietterich, L. H., Fitzgerald, G., Hasegawa, T., Holbrook, N. M., Nelson, R. L., Ottman, M. J., Raboy, V., Sakai, H., Sartor, K. A., Schwartz, J., Seneweera, S., Tausz, M., & Usui, Y. (2014). Increasing CO2 threatens human nutrition. Nature, 510(7503), 139–142. https://doi.org/10.1038/nature13179
National Wildlife Federation. (2016, August 8). Learning From Tropical Storm Irene. The National Wildlife Federation Blog. https://blog.nwf.org/2016/08/learning-from-tropical-storm-irene/
Niles, M. T., Josephson, A. L., Bertmann, F., Belarmino, E. H., & Ne, R. (2021). COVID-19 and food insecurity impacts: A follow-up Vermont Study—Food insecurity remains high and food assistance program use increases significantly. 3.
NIOSH. (2016). NIOSH criteria for a recommended standard: Occupational exposure to heat and hot environments (No. 2016–106; p. 192). U.S. Dept. of Health and Human Services, Centers for Disease Control and Prevention, National Institute for Occupational Safety and Health, DHHS (NIOHS). https://www.cdc.gov/niosh/topics/heatstress/recommendations.html
NOAA National Centers for Environmental Information. (2021). Climate at a Glance: Statewide Time Series. https://www.ncdc.noaa.gov/cag/statewide/time-series/43/tmin/ann/12/1971-2021?trend=true&trend_base=10&begtrendyear=1971&endtrendyear=2021
NOAA NWS Burlington. (2021). Heatwave.pdf. Burlington, Vermont Heat Waves. https://www.weather.gov/media/btv/climo/extremes/heatwave.pdf
Nonenmacher, R.A. (2014). Ambrosia artemisiifolia [Photo]. https://upload.wikimedia.org/wikipedia/commons/b/b4/Ambrosia_artemisiifolia_9389.jpg
NY Dept. of Health. (2017). E. coli O157:H7 Infection Fact Sheet. E. Coli Infection. https://www.health.ny.gov/diseases/communicable/e_coli/o157.htm
Patz, J. A. (2003). Climate change and health: new research challenges. In Managing for healthy ecosystems (pp. 77–86). CRC Press.
Patz, J. A., Epstein, P. R., Burke, T. A., & Balbus, J. M. (1996). Global Climate Change and Emerging Infectious Diseases. JAMA, 275(3), 217–223. https://doi.org/10.1001/jama.1996.03530270057032
Patz, J. A., & Frumkin, H. (2016). Climate Change and Human Health. John Wiley & Sons.
Patz, J. A., Graczyk, T. K., Geller, N., & Vittor, A. Y. (2000). Effects of environmental change on emerging parasitic diseases. International Journal for Parasitology, 30(12), 1395–1405. https://doi.org/10.1016/S0020-7519(00)00141-7
Paz, S. (2015). Climate change impacts on West Nile virus transmission in a global context. Philosophical Transactions of the Royal Society B: Biological Sciences, 370(1665). https://doi.org/10.1098/rstb.2013.0561
Peterson, T. C., Karl, T. R., Kossin, J. P., Kunkel, K. E., Lawrimore, J. H., McMahon, J. R., Vose, R. S., & Yin, X. (2014). Changes in weather and climate extremes: State of knowledge relevant to air and water quality in the United States. Journal of the Air & Waste Management Association, 64(2), 184–197. https://doi.org/10.1080/10962247.2013.851044
Polhamus, M. (2017, October 22). State experts predict uptick in tick-borne diseases will continue. VTDigger. https://vtdigger.org/2017/10/22/state-experts-predict-uptick-tick-borne-diseases-will-continue/
Pragna, P., Archana, P. R., Aleena, J., Sejian, V., Krishnan, G., Bagath, M., Manimaran, A., Beena, V., Kurien, E. K., Varma, G., & Bhatta, R. (2016). Heat Stress and Dairy Cow: Impact on Both Milk Yield and Composition. International Journal of Dairy Science, 12(1), 1–11. https://doi.org/10.3923/ijds.2017.1.11
Ready-Campbell, C. (September 22, 2017). Experts: Dairy’s future in Vermont sweeter than maple’s. VTDigger. https://vtdigger.org/2017/09/22/experts-dairys-future-vermont-sweeter-maples/
Reidmiller, D.R., Avery, C.W., Easterling, D.R., Kunkel, K.E., Lewis, K.L.M., Maycock, T.K., Stewart, B.C., 2018. Impacts, Risks, and Adaptation in the United States: The Fourth National Climate Assessment, Volume II. U.S. Global Change Research Program. https://doi.org/10.7930/NCA4.2018
Reiss, F., Meyrose, A.-K., Otto, C., Lampert, T., Klasen, F., & Ravens-Sieberer, U. (2019). Socioeconomic status, stressful life situations and mental health problems in children and adolescents: Results of the German BELLA cohort-study. PLoS ONE, 14(3). https://doi.org/10.1371/journal.pone.0213700
Ritchie, H., & Roser, M. (2017). Air Pollution. Our World in Data. https://ourworldindata.org/air-pollution
Robbins, J. (2020, January 9). Ecopsychology: How Immersion in Nature Benefits Your Health. Yale E360. https://e360.yale.edu/features/ecopsychology-how-immersion-in-nature-benefits-your-health
Rocklöv, J., & Dubrow, R. (2020). Climate change: An enduring challenge for vector-borne disease prevention and control. Nature Immunology, 21(5), 479–483. https://doi.org/10.1038/s41590-020-0648-y
Rudolph, L & Harrison, C. (2016). A Physician’s Guide to Climate Change, Health and Equity. Public Health Institute. Oakland, CA. https://climatehealthconnect.org/wp-content/uploads/2016/09/FullGuideTEMP.pdf
Salas, R. N., Malina, D., & Solomon, C. G. (2019). Prioritizing Health in a Changing Climate. New England Journal of Medicine. https://doi.org/10.1056/NEJMe1909957
Sass, J. B., & Colangelo, A. (2006). European Union Bans Atrazine, While the United States Negotiates Continued Use. International Journal of Occupational and Environmental Health, 12(3), 260–267. https://doi.org/10.1179/oeh.2006.12.3.260
Saxton-Shaw, K. D., Ledermann, J. P., Kenney, J. L., Berl, E., Graham, A. C., Russo, J. M., Powers, A. M., & Mutebi, J.-P. (2015). The First Outbreak of Eastern Equine Encephalitis in Vermont: Outbreak Description and Phylogenetic Relationships of the Virus Isolate. PLOS ONE, 10(6), e0128712. https://doi.org/10.1371/journal.pone.0128712
Schlanger, Z. (2017). Climate change is causing PTSD, anxiety, and depression on a mass scale. Quartz. https://qz.com/948909/ecoanxiety-the-american-psychological-association-says-climate-change-is-causing-ptsd-anxiety-and-depression-on-a-mass-scale/
Shambaugh, A. (2020). Cyanobacteria Monitoring on Lake Champlain and Vermont Inland Lakes Summer 2019.
Shen, L., Mickley, L. J., & Gilleland, E. (2016). Impact of increasing heat waves on U.S. ozone episodes in the 2050s: Results from a multimodal analysis using extreme value theory. Geophysical Research Letters, 43(8), 4017–4025. https://doi.org/10.1002/2016GL068432
Sherman, A., Juillerat, J., & Roberts, D. (2019). 2018 Vermont Wood Fuel Supply Study (Vermont Wood Fuel Supply Study, p. 44). VT Dept of Forests, Parks and Recreation. https://fpr.vermont.gov/sites/fpr/files/Forest_and_Forestry/Wood_Biomass_Energy/Library/2018%20VWFSS%20Final%20Report%20with%20Letter.pdf
Shulins, N. (2014, November 2). After Irene, Vermont shows us what climate resilience looks like. Grist. https://grist.org/climate-energy/after-irene-vermont-shows-us-what-climate-resilience-looks-like/
Simmering, J. E., Polgreen, L. A., Hornick, D. B., Sewell, D. K., & Polgreen, P. M. (2017). Weather-Dependent Risk for Legionnaires’ Disease, United States. Emerging Infectious Diseases, 23(11), 1843–1851. https://doi.org/10.3201/eid2311.170137
Smith, K. R., Woodward, A., Campbell-Lendrum, D., Chadee, D. D., Honda, Y., Liu, Q., Olwoch, J. M., Revich, B., & Sauerborn, R. (2014). Human Health: Impacts, Adaptation, and Co-Benefits. In C. B. Field, V. R. Barros, D. J. Dokken, K. J. Mach, M. D. Mastrandrea, T. E. Bilir, M. Chatterjee, K. Ebi, Y. O. Estrada, R. C. Genova, B. Girma, E. S. Kissel, A. N. Levy, S. MacCracken, P. R. Mastrandrea, & L. L. White (Eds.), Climate Change 2014: Impacts, Adaptation, and Vulnerability. Part A: Global and Sectoral Aspects. Contribution of Working Group II to the Fifth Assessment Report of the Intergovernmental Panel on Climate Change (p. 46). Cambridge University Press.
Smith, M. R., & Myers, S. S. (2018). Impact of anthropogenic CO2 emissions on global human nutrition. Nature Climate Change, 8(9), 834–839. https://doi.org/10.1038/s41558-018-0253-3
Stager, C., & Thill, M. (2010). Climate Change in the Champlain Basin (p. 44) [Technical and Demonstration]. The Nature Conservancy. https://www.lcbp.org/publications/climate-change-champlain-basin/
State of Vermont. (2021a). Climate change effects: Flooding. Climate Change in Vermont. https://climatechange.vermont.gov/our-changing-climate/what-it-means/flooding
State of Vermont. (2021b). Emissions & Goals. Climate Change in Vermont. https://climatechange.vermont.gov/climate-pollution-goals
State of Vermont. (2021c). Welcome to Flood Ready Vermont. Flood Ready Vermont. https://floodready.vermont.gov/
Stinson, K. A., Albertine, J. M., Hancock, L. M. S., Seidler, T. G., & Rogers, C. A. (2016). Northern ragweed ecotypes flower earlier and longer in response to elevated CO2: What are you sneezing at? Oecologia, 182(2), 587–594. https://doi.org/10.1007/s00442-016-3670-x
Swinton, M. W., & Nierzwicki-Bauer, S. A. (2020). Mercury increase in Lake Champlain fish: Links to fishery dynamics and extreme climatic events. Ecotoxicology, 29(10), 1750–1761. https://doi.org/10.1007/s10646-019-02148-5
Tang, W.-L., Liu, Y.-R., Guan, W.-Y., Zhong, H., Qu, X.-M., & Zhang, T. (2020). Understanding mercury methylation in the changing environment: Recent advances in assessing microbial methylators and mercury bioavailability. Science of The Total Environment, 714, 136827. https://doi.org/10.1016/j.scitotenv.2020.136827
Terry, P. D., Heidel, R. E., & Dhand, R. (2021). Asthma in Adult Patients with COVID-19. Prevalence and Risk of Severe Disease. American Journal of Respiratory and Critical Care Medicine, 203(7), 893–905. https://doi.org/10.1164/rccm.202008-3266OC
U. Vermont Extension, & VT Housing & Conservation Board. (2018). A 2018 exploration of the future of Vermont agriculture: Ideas to seed a conversation and a call to action (p. 8). University of Vermont. https://www.uvm.edu/sites/default/files/media/Future-of-VT-Ag-Report-2018-Final_5.pdf
Union of Concerned Scientists. (2010). Water and Climate Change. https://www.ucsusa.org/resources/water-and-climate-change
United Health Foundation. (2021). America’s Health Rankings: Asthma & Vermont [Annual Report]. United Health Foundation. https://www.americashealthrankings.org/explore/annual/measure/Asthma_a/state/VT
U.S. Census Bureau. (2019). Population and Housing Unit Estimates. Population Estimates Program (PEP).
US EIA. (2020). Vermont State Energy Profile. US Energy Information Administration. https://www.eia.gov/state/print.php?sid=VT
U.S. EPA. (2013). Integrated Science Assessment (ISA) for Ozone and Related Photochemical Oxidants (EPA/600/R-10/076F; p. 1251). U.S. Environmental Protection Agency, Office of Research and Development, National Center for Environmental Assessment-RTP Division. https://cfpub.epa.gov/ncea/isa/recordisplay.cfm?deid=247492
U.S. EPA. (2020). Integrated Science Assessment (ISA) for Ozone and Related Photochemical Oxidants (EPA/600/R-20/012). U.S. Environmental Protection Agency, Office of Research and Development, National Center for Environmental Assessment-RTP Division. https://cfpub.epa.gov/ncea/isa/recordisplay.cfm?deid=348522
US EPA, O. (2014, September 3). Improving Indoor Air Quality [Overviews and Factsheets]. US EPA. https://www.epa.gov/indoor-air-quality-iaq/improving-indoor-air-quality
US EPA, O. (2015a, September 3). Health Effects of Exposures to Mercury [Overviews and Factsheets]. https://www.epa.gov/mercury/health-effects-exposures-mercury
US EPA, O. (2015b, September 15). Basic Information about Nonpoint Source (NPS) Pollution [Overviews and Factsheets]. https://www.epa.gov/nps/basic-information-about-nonpoint-source-nps-pollution
US Global Change Research Program. (2010). Agriculture (Global Climate Change Impacts in the US, p. 8) [National Climate Assessment]. USGCRP. https://downloads.globalchange.gov/usimpacts/pdfs/agriculture.pdf
USGCRP. (2018). Fourth National Climate Assessment (pp. 1–470). U.S. Global Change Research Program, Washington, DC. https://nca2018.globalchange.govhttps://nca2018.globalchange.gov/chapter/18
USGS. (2021). Surface Runoff and the Water Cycle. Water Science School. https://www.usgs.gov/special-topic/water-science-school/science/surface-runoff-and-water-cycle?qt-science_center_objects=0#qt-science_center_objects
van Elsas, J. D., Semenov, A. V., Costa, R., & Trevors, J. T. (2011). Survival of Escherichia coli in the environment: Fundamental and public health aspects. The ISME Journal, 5(2), 173–183. https://doi.org/10.1038/ismej.2010.80
Vermont Emergency Management. (2018). 2018 Vermont State Hazard Mitigation Plan: Making Vermont safer and more resilient in the face of climate change and natural disasters. https://vem.vermont.gov/sites/demhs/files/documents/2018%20Vermont%20State%20Hazard%20Mitigation%20Plan%20-%20Final%20Adopted_Interactive.pdf
VPIC. (2012). Green Infrastructure (Vermont Land Use Education & Training Collaborative). https://vtcommunityforestry.org/sites/default/files/pictures/Resource/greeninfrastructure.pdf
VT Agency of Agriculture, Food and Markets. (2013, February). Eastern equine encephalitis virus in Vermont: Update for the Vermont legislature. https://legislature.vermont.gov/Documents/2014/WorkGroups/Senate%20Health%20and%20Welfare/Eastern%20Equine%20Encephalitis/W~Harry%20Chen~Eastern%20Equine%20Encephalitis%20Virus%20in%20Vermont~2-28-2013.pdf
VT Agency of Agriculture, Food and Markets. (2017). 2017 Mosquito Surveillance Report (p. 9). Vermont Agency of Agriculture, Food & Markets. https://agriculture.vermont.gov/sites/agriculture/files/documents/PHARM/MosquitoTick/2017%20Mosquito%20Report.pdf
VT Agency of Agriculture, Food and Markets. (2018). 2018 Mosquito Surveillance Report (p. 9). VT Agency of Agriculture, Food and Markets. https://agriculture.vermont.gov/sites/agriculture/files/documents/PHARM/MosquitoTick/photos/2018%20Mosquito%20Report.pdf
VT Agency of Agriculture, Food and Markets. (2019a). 2019 Mosquito Surveillance Report (p. 7). VT Agency of Agriculture, Food and Markets. https://agriculture.vermont.gov/sites/agriculture/files/documents/PHARM/MosquitoTick/2019%20Mosquito%20Surveillance%20Report_Revised121319.pdf
VT Agency of Agriculture, Food and Markets. (2019b). State of Vermont Arbovirus Surveillance and Response Plan (p. 20). Agency of Agriculture, Food & Markets, Department of Health. https://www.healthvermont.gov/sites/default/files/documents/pdf/HS_ID_VT_Arbovirus_%20Plan_2017.pdf
VT Agency of Agriculture, Food and Markets. (2020). 2020 Vermont Mosquito Surveillance Report (p. 7). VT Agency of Agriculture, Food and Markets. https://agriculture.vermont.gov/sites/agriculture/files/documents/PHARM/MosquitoTick/2020%20Vermont%20Mosquito%20Surveillance%20Report_Revised120820.pdf
VT Agency of Agriculture, Food and Markets. (2021a). Annual Mosquito Reports. Annual Mosquito Reports. https://agriculture.vermont.gov/public-health-agricultural-resource-management-division/plant-health-and-pest-management-2
VT Agency of Agriculture, Food and Markets. (2021b). Ticks. Public Health & Agricultural Resource Management. https://agriculture.vermont.gov/public-health-agricultural-resource-management-division/plant-health-and-pest-management/ticks
VT ANR. (2021). What Changes are Occurring? | Climate Change in Vermont. https://climatechange.vermont.gov/content/what-changes-are-occurring
VT DEC. (2010). Vermont low impact development guide for residential and small sites (p. 54). State of Vermont Department of Environmental Conservation. https://dec.vermont.gov/sites/dec/files/wsm/stormwater/docs/Resources/sw_LID%20Guide.pdf
VT DEC. (2014). Mercury in fish advisory card (p. 2). VT DEC. https://dec.vermont.gov/sites/dec/files/wmp/SolidWaste/Documents/fishadvisorycard.pdf
VT DEC. (2018). 2018 303(d) List of impaired waters (p. 59). State of Vermont Department of Environmental Conservation. https://www.epa.gov/sites/default/files/2019-02/documents/2018-vt-303d-list-report.pdf
VT DEC. (2021a). Air Pollutants and Health. https://dec.vermont.gov/air-quality/pollutants-health
VT DEC. (2021b). Green Infrastructure. Water Solutions. https://dec.vermont.gov/water-investment/cwi/solutions/developed-lands/green-infrastructure
VT DEC. (2021c). Mercury and Other Persistent Pollutants. Watershed Management. https://dec.vermont.gov/watershed/lakes-ponds/learn/mercury
VT DEC. (2021d). Mercury in Fish. Waste Management and Prevention. https://dec.vermont.gov/waste-management/solid/product-stewardship/mercury/fish
VT DEC. (2021e). Stormwater Impaired Waters. Watershed Management. https://dec.vermont.gov/watershed/stormwater/impaired-waters
VT DEC. (2021f). Vermont Cyanobacteria (Blue-Green Algae) Tracker. https://ahs-vt.maps.arcgis.com/apps/webappviewer/index.html?id=a46d42c05e864a198ab5dc152f9d09b9
VT DEC. (2021g). What You Can Do. Air Quality & Climate. https://dec.vermont.gov/air-quality/what-you-can-do
VT Dept. Health. (2015). Social Vulnerability Index: A User’s Guide (p. 4). State of Vermont, Dept. of Health. https://www.healthvermont.gov/sites/default/files/documents/2016/12/ENV_EPHT_SocialVulnerabilityIndex.pdf
VT Dept. Health. (2016a). Heat Vulnerability in Vermont (Environmental Health, p. 44). VT Dept. of Health. https://www.healthvermont.gov/sites/default/files/documents/2016/12/ENV_EPHT_heat_vulnerability_in_VT_0.pdf
VT Dept. Health. (2016b). The disparate burden of asthma among the Medicaid insured in Vermont—2016 (p. 4). VT Dept. of Health. https://www.healthvermont.gov/sites/default/files/documents/2016/12/data_brief_asthma_medicaid.pdf
VT Dept. Health. (2016c). Vermont Heat Vulnerability Index (p. 2). https://www.healthvermont.gov/sites/default/files/documents/2016/12/ENV_EPHT_heat_vulnerability_index.pdf
VT Dept. Health. (2016d, July 18). Climate Change and Waterborne and Foodborne Diseases. Vermont Department of Health. https://www.healthvermont.gov/health-environment/climate-health/water-foodborne-diseases
VT Dept. Health. (2017a). Climate Change and Health in Vermont (Climate Change Adaptation White Paper Series, p. 26). VT Dept. of Health and Agency of Natural Resources. https://www.healthvermont.gov/sites/default/files/documents/pdf/ENV_CH_WhitePaper.pdf
VT Dept. Health. (2017b). Wood heat and indoor air quality (p. 2). VT Dept. of Health. https://www.healthvermont.gov/sites/default/files/documents/pdf/ENV_CH_WoodHeat%26IndoorAirQuality.pdf
VT Dept. Health. (2018a). Climate Change and Mental Health. Vermont Department of Health. https://www.healthvermont.gov/health-environment/climate-health/mental-health
VT Dept. Health. (2018b). Private drinking water: A user’s guide (p. 2) [Environmental Health Spotlight]. VT Dept. of Health, Environmental and Public Health Tracking. https://www.healthvermont.gov/sites/default/files/documents/pdf/ENV_EPHT_PrivateDrinkingWaterSpotlight.pdf
VT Dept. Health. (2018c). Vermont Tickborne Disease Program (2018 Report; p. 7). VT Dept. of Health. https://www.healthvermont.gov/sites/default/files/documents/pdf/HS-ID-2018-Tickborne-Disease-Annual-Report.pdf
VT Dept. Health. (2018d). Weatherization + Health: Health and climate change co-benefits of home weatherization in Vermont (p. 47). VT Dept. of Health, Climate & Health Program. https://www.healthvermont.gov/sites/default/files/documents/pdf/ENV_CH_WxHealthReport.pdf
VT Dept. Health. (2018e, December 24). Climate Change and Cyanobacteria (Blue-Green Algae). Climate & Health. https://www.healthvermont.gov/health-environment/climate-health/cyanobacteria
VT Dept. Health. (2018f, December 24). Climate Change and Mosquito-Borne Diseases. Climate & Health. https://www.healthvermont.gov/health-environment/climate-health/mosquito-borne-diseases
VT Dept. Health. (2018g, December 24). Climate Change and Pollen, Mold and Air Quality. Climate & Health. https://www.healthvermont.gov/health-environment/climate-health/pollen-and-air-quality
VT Dept. Health. (2019a). Eastern Equine Encephalitis. Mosquito-Borne Diseases. https://www.healthvermont.gov/disease-control/mosquito-borne-diseases/eastern-equine-encephalitis
VT Dept. Health. (2019b). Emergency Department Visits Related to Heat Stress Dataset on the Vermont Tracking Public Portal 2003-2016 (Dataset EPHTN Metadata Record ID: VT6; VT Environmental Health Tracking Program). VT Dept. of Health. https://apps.health.vermont.gov/ias/querytool?Topic=EPHT
VT Dept. Health. (2019c). Lyme Disease. Vermont Department of Health. https://www.healthvermont.gov/disease-control/tickborne-diseases/lyme-disease
VT Dept. Health. (2019d). West Nile Virus. Disease Control: Mosquito Borne Diseases. https://www.healthvermont.gov/disease-control/mosquito-borne-diseases/west-nile-virus
VT Dept. Health. (2019e, April 2). Tracking air quality in Vermont. Vermont Department of Health. https://www.healthvermont.gov/tracking/air-quality
VT Dept. Health. (2019f, August 8). Respiratory Disease Scorecard. Vermont Department of Health- How Are We Doing? Performance Scorecards. https://www.healthvermont.gov/scorecard-respiratory-disease
VT Dept. Health. (2019g, December 18). Asthma surveillance in Vermont. Health Statistics & Vital Records. https://www.healthvermont.gov/health-statistics-vital-records/surveillance-reporting-topic/asthma
VT Dept. Health. (2020, January 22). Legionnaires’ Disease. Vermont Department of Health. https://www.healthvermont.gov/immunizations-infectious-disease/other-reportable-diseases/legionnaires-disease
VT Dept. Health. (2021a). Community Cooling Center Guidance (p. 2). VT Dept. of Health. https://www.healthvermont.gov/sites/default/files/documents/pdf/ENV-CH-community-cooling-center-guidance.pdf
VT Dept. Health. (2021b). Healthy Homes. Health & the Environment. https://www.healthvermont.gov/environment/home
VT Dept. Health. (2021c). Hot weather and health impacts. Climate & Health. https://www.healthvermont.gov/health-environment/climate-health/hot-weather
VT Dept. Health. (2021d). Tracking air quality in Vermont (Data Explorer). State of Vermont, Dept. of Health. https://apps.health.vermont.gov/ias/querytool?Topic=EPHT&Theme1=Air
VT Dept. Health. (2021e, February 18). Winter Weather. Climate & Health. https://www.healthvermont.gov/environment/climate/winter-weather
VT Dept. Housing and Community Development. (2015). Vermont Economic Resiliency Initiative (p. 728). VT Agency of Commerce & Community Development, Dept. of Housing and Community Development. https://accd.vermont.gov/sites/accdnew/files/documents/CD/CPR/CPR-VERI-FinalReport.pdf
VT Dept. Public Service. (2021). Total Energy Study. Energy Resources. https://publicservice.vermont.gov/publications-resources/publications/total_energy_study
VT Emergency Management. (2018). 2018 Vermont State Hazard Mitigation Plan. https://vem.vermont.gov/sites/demhs/files/documents/2018%20Vermont%20State%20Hazard%20Mitigation%20Plan%20-%20Final%20Adopted_Interactive.pdf
VT UCF. (2021). Tree Canopy Assessments. Vermont Urban and Community Forestry Inventories and Management Plans. https://vtcommunityforestry.org/resources/inventories-management-plans/tree-canopy-assessments
VTLyme.org. (2018). Symptoms of different tick-borne diseases in Vermont (p. 2). VT Lyme. https://vtlyme.org/wp-content/uploads/2018/03/Printable-Symptoms-of-Different-Tick-borne-diseases-in-Vermont.pdf
Wang, Z., Wu, X., Dai, W., Kaminga, A. C., Wu, X., Pan, X., Liu, Z., Wen, S., Hu, S., & Liu, A. (2019). The Prevalence of Posttraumatic Stress Disorder Among Survivors After a Typhoon or Hurricane: A Systematic Review and Meta-Analysis. Disaster Medicine and Public Health Preparedness, 13(5–6), 1065–1073. https://doi.org/10.1017/dmp.2019.26
WHO. (2016). Ambient air pollution: A global assessment of exposure and burden of disease (p. 121). United Nations World Health Organization. https://apps.who.int/iris/handle/10665/250141xmACIS. (2021, January 24). Applied Climate Information System NOAA Regional Climate Centers. http://xmacis.rcc-acis.org/
xmACIS. (2021, January 24). Applied Climate Information System NOAA Regional Climate Centers. http://xmacis.rcc-acis.org/